Platforms and services
In this section you will find all the information about Fineco's platforms, which provide all the necessary instruments to manage your trading in the best possible way:
- FinecoX: FinecoX is the trading platform developed by Fineco that stands out for its customisation, advanced functionality, rapidity of information and operational completeness.
The data are strictly real-time push (if push is enabled for the market in question). Trading is available on all equities, ETFs, Certificates, Options, CFDs and Forex, Futures, Bonds and Covered Warrants. The structure of FinecoX is designed to allow you to visualise much more data at a glance. It is fully customisable and you can simultaneously view watchlists, charts, news, your portfolio and order monitor and always have your profits and losses under control, even on a daily basis. - PowerDesk Fineco’s proprietary platform for professional trading: simple, quick and user-friendly. A single, easy-to-use and customisable screen that allows you to trade on more than 20 markets in push mode, perform intraday and multiday trading, place automatic orders, use the vertical book, chart trading, basket orders and much more besides.
- PowerChart: This is one of the most advanced systems for studying markets and financial instruments using integrated technical analysis indicators, and for the usability of all the tools at its disposal.
- PowerCell, the DDE platform that allows you to use automatic update formulas and download data in real time, available from PowerDesk.
FinecoX
FinecoX is the platform that revolutionizes the way of trading: advanced, customizable and innovative.
FAQ
Are there any activation fees/costs?
The platform is free for all Fineco customers.
How to install FinecoX?
FinecoX is a web platform developed in Html5. It is accessed via a browser and does not require any download or installation. You can access directly from the private area of the Fineco website or from the dedicated FinecoX page by entering the access codes to the Fineco account.
Can I also use it from a tablet?
Of course, the platform is accessible from both PCs and tablets, it is important that the device meets the minimum requirements.
In fact, the platform can be used through the main operating systems.
Do I need to sign up for a new account or service?
No: the platform is available free of charge to all customers. It is also integrated into the account, which means that all orders placed on the FinecoX platform will then be visible in the portfolio section also on the Website and FinecoAPP.
Do I have to transfer liquidity in order to trade?
No, the platform is integrated into the account and you can use the liquidity available in the Fineco account.
Which products and markets can I invest in?
You can invest in all the financial markets and securities available with a Fineco account. Funds are excluded.
Can I use the platform with my ISA account?
No: FinecoX is available only with your standard account.
Technical requirements
Below are the suggested IT requirements for using the FinecoX platform to its full potential:
Chrome: 85.0
Opera: 70.0
Edge: 85.0
Firefox: 80.0
Safari: 14.0.2
At least 8 GB of RAM is recommended.
At least an Intel i5 / AMD Ryzen 5 processor (equivalent or higher) is recommended.
Stable, high-performance internet connection.
Minimum resolution FHD.
User manual
You can find out in detail all the features of the platform by accessing the manual available by clicking here
PowerDesk
Introduction
General presentation
PowerDesk is the multi-market platform, using all push notifications, entirely developed by Fineco. It is characterised by advanced functionality, timely information and a full range of trading options.
Trading is available on equity securities, ETFs, Covered Warrants, Certificates, Currencies, Options, Futures, Bonds, CFDs on shares, indices, CFDs Logos Time and Forex.
With PowerDesk you can access the following stock exchanges: MTA, SeDeX, Nasdaq, Amex, Nyse, Euronext (France, The Netherlands, Portugal) Xetra, Ibex, LSE (Sets), Virt-x, Hex25, Idem, Eurex, CME, Forex, TLX, EuroTLX, Mot and EuroMot.
Main features
The horizontal format of PowerDesk has been designed as you can view all the data at the same time without having to carry out any configuration. Pre-set watchlists with the baskets of UK, European and American share indices and the lists of Futures traded on Idem, Eurex and CME, MOT and ETLX bonds, Forex, Options and CFDs; 8 fully customisable lists; news, order and portfolio screens are always in the foreground.
The top section of the platform includes:
- The Profit & Loss account, which shows the trading portfolio performance in real time.
- The dashboard with the reserved funds and the balance in a currency which can be selected from the drop-down menu.
- The button for currency exchange (€, $, £ and CHF).
- The button to activate Workspace (a customisable workspace)
- Platform management buttons: Preferences and Help.
- Buttons to set the PowerDesk dimensions.
- Market Bar, the fully customisable ticker, updated in real time.
![]()
The central section of the platform contains the lists of securities:
- At the end of each row, you can set up to two functions choosing from: an advanced technical analysis chart, the list of Covered Warrants with the pertinent underlying instrument, the Vertical Book and the PowerBoard.
- Symbol search.
- Buttons to manage the tools included in each Watchlist.
- Font size management tool.
- PowerCell, the command to copy the data in the Watchlist and export it to Excel spreadsheets, for example to use the DDE engine.
- Predefined lists from FTSE MIB, Mid Cap, Star, Dow Jones 30, Nasdaq 100, Germany, France, United Kingdom, Spain, Switzerland, The Netherlands, Portugal, Finland, TLX, Mot, Idem, Eurex, CME, CFDs on Indices, Forex and Options.
- Customisable lists.
- Best-Worst
- Ranking
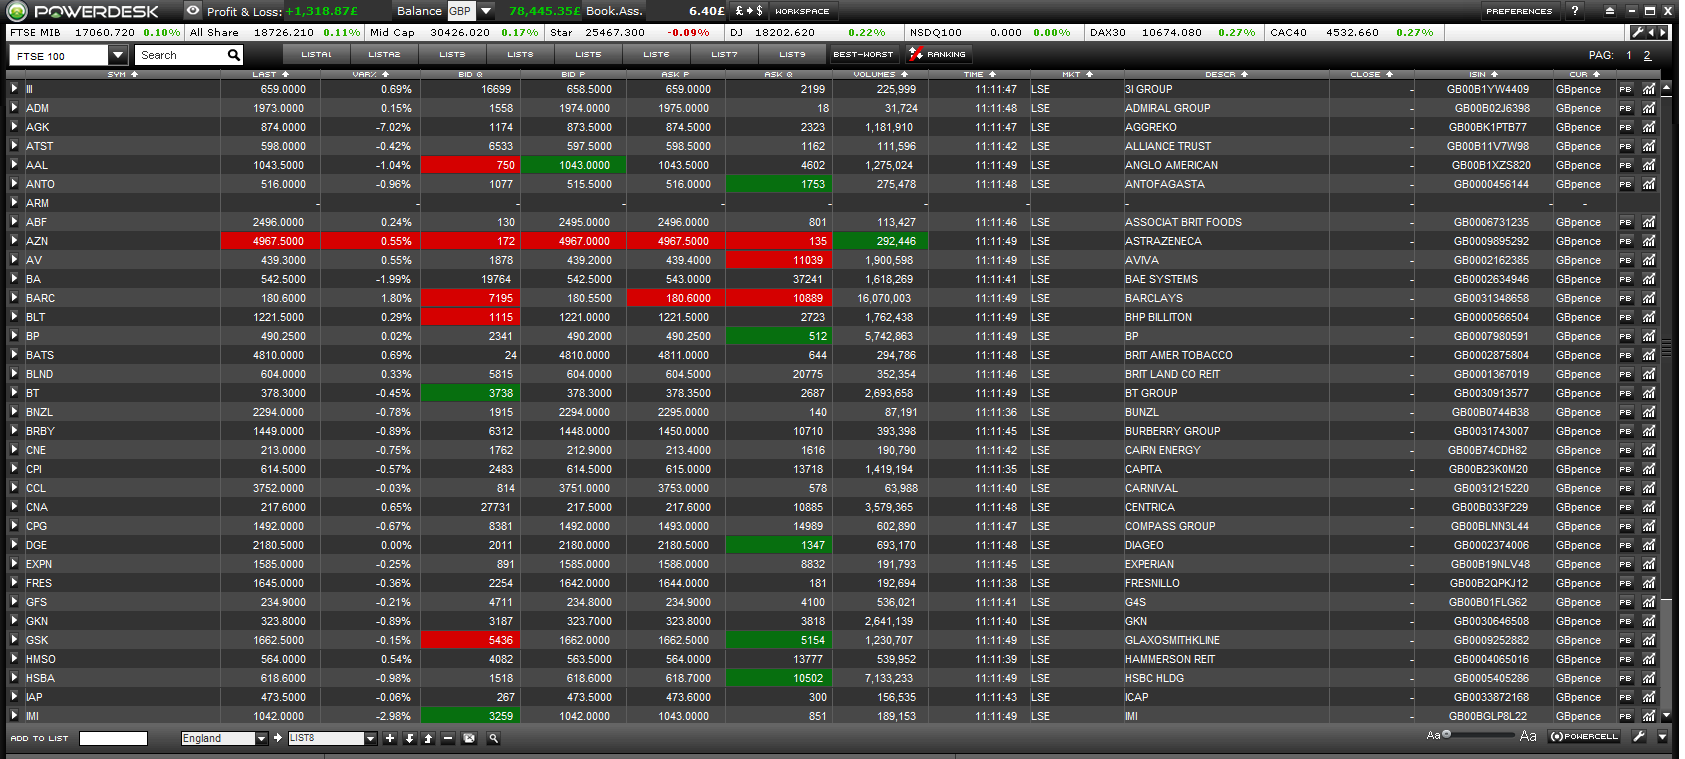
The bottom section of the platform is divided into three areas and the height can be varied to give more space to the element you require.
By default, the panels include:
- News, Indices and Spread.
- Order Screen, Alerts and conditions, P&L and Baskets.
- Portfolio.
The size of each panel (portfolio, order screen, news) can be fully customised simply by selecting and dragging the side edge.

Security detail: each row of the Watchlist can be expanded to display the specific information about a financial product. Each expansion is divided into three areas where various information and tools can be found:
- On the left and right you can click and choose whether to see the five-level Book, the order screen for the single product, the tick by tick mini-chart, the news concerning the security and Time & Sales.
- The central part is used for trading and has two different screens for entering orders: Trade view and the window for conditional orders.

Activation and deactivation
To use PowerDesk, the service must be activated by clicking on "Subscribe/Unsubscribe" in the website area reserved for activations (Home Customer - Request new services). Activation is immediate: once you have completed the procedure, just log in again in order to use PowerDesk. Deactivation takes effect from the first day of the following month.
Technical data sheet
PowerDesk does not require software to be installed on your computer: however you do need Sun Java Virtual Machine. This means PowerDesk can be used anywhere and is not restricted to any specific PC: simply go to the Fineco website and click on the Powerdesk link or on Start to launch the platform.
You can also use the stand-alone platform by pressing the "download" button in the platforms and services section.
In both cases, a jnlp file will be downloaded which can be run manually if it does not open automatically.
Windows
To use PowerDesk, the minimum configuration required is: a Pentium IV processor, 1024 MB RAM, ADSL connection (minimum), 1280x1024 Monitor resolution, Windows 7, Internet Explorer 9 and Sun Java Virtual Machine version 8+.
Apple
PowerDesk is compatible with Macintosh, with an OS-X 10.7 or higher (Lion) operating system, recommended browser Safari, and Java Virtual Machine version 6+.
Installing Oracle Java Virtual Machine
To install the correct version of Virtual Machine on your computer, simply click on: http://www.java.com/en/download/download_the_latest.jsp
Technical notes
- Java components can be downloaded and installed by the system administrator for company networks.
- The RAM indicated is not the actual amount of memory used by the application, but is an indicative value to guarantee normal computer use. The value indicated is therefore the sum of the memory allocated by the operating system and the amount needed to use the trading platform and other programmes such as MS Excel or TradeStation.
- To be able to use PowerDesk with antivirus/firewall acting on the connection, you need to check the correct configuration of the finecobank.com domain with the antivirus manufacturer and enter it as trusted. In particular, PowerDesk connects to the powerdesk.finecobank.com machines through ports 80 and 443.
PowerDesk maintenance
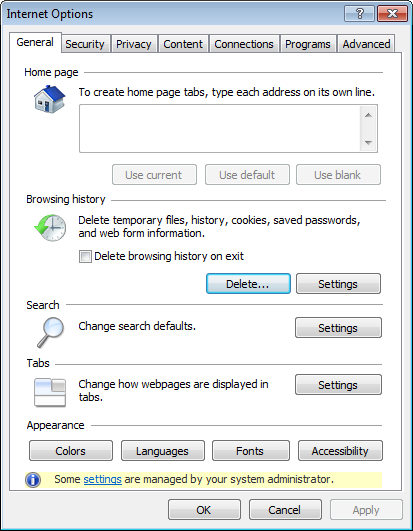
For optimum use of PowerDesk, we recommend that you regularly (at least once a week) clean out the Temporary Internet and Cookie Files which may be found among the Internet options of your browser. For example, for Internet Explorer, just click on Internet Options in the Browser Tools menu.
Functionality
Management controls
The platform’s management controls are located in the top right corner.

- the help button
 is connected to the Help Station: the User Manual may be viewed there
 - The PowerDesk Preferences button
- This function
 transforms the PowerDesk platform into an independent ticker which contains the following information:
- Profit & Loss.
- Dashboard showing reserved funds and the balance in the selected currency.
- Market Bar. - Windows Controls
 to minimise PowerDesk, to resize it and to close it.
Account switch
If you have more than one current account, you could select the account on which to trade directly from Powerdesk by clicking on the “account” button in the top section of the platform.

By clicking on it, a pop up will be displayed as follow:
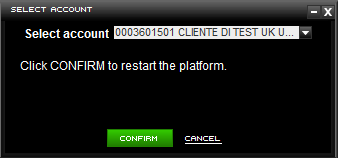
By clicking on CONFIRM the account data will recharge and the personal WL, the Portfolio, the order monitor and the P & L., too.
Note: Joint accounts are divided into several sub-portfolios: an individual portfolio for each account holder and a joint portfolio held in common. In order to load the right sub-portfolio it is necessary to previously set it as default in the Client Area, at the website section: Home / Account Management / Managing Services / Banking and Cards / Sub - Portfolios and click on Edit.
Preferences
The  link opens the personal settings window and these settings are also stored for subsequent accesses.
The window has several sections:
- General settings
- Market Bar
- Order
- Watchlist
- Screen
- PowerBoard
Settings and any changes are managed by using these three buttons:

> Restore Setting > allows you to cancel all changes made and to restore the initial settings.
> Confirm > allows you to save the changes made.
> Cancel > is used in order not to implement any changes.
> General
The PowerDesk graphic settings can be selected in this section
- the colour scheme: black, ice, sky blue, light blue, dark blue and grey;
- the method of displaying every upward or downward price change by highlighting: the cell border, the background or only the text;
- the "shutdown" speed of the cells after each update. This function allows you to change the speed, measured in milliseconds, at which cells are shut down. The value can be selected from the drop-down menu: the lower the value selected, the faster the cell illumination is "shut down".
Other configurations
It is possible to select:
- the size of the font, choosing among small, medium or large;
- the balance display;
- the pop-ups display (graphics, portfolio, screens, etc.) always in the foreground.
You can also define the configuration of the bottom panels, choosing the best combination between: Indices, News, Spread and Portfolio.
Alerts
Settings and defaults: when an alert is triggered on a security, you can choose whether to be notified by pop-up, email or text message. Note: Before you can use email or text alerts, it is important to ensure these contacts have been certified by Fineco.
Closing options: you can set a request for confirmation when the platform closes in this section.
> Market Bar
This section allows you to choose which contents should be included in the horizontal ticker located below the PowerDesk logo.
You can choose any financial instrument: shares, indices, futures or currencies. Powerchart, the technical analysis chart, opens by clicking on the symbol.

> Order
With PowerDesk you can decide the default quantity for the 25 securities you trade most frequently.

By clicking on the button, the relevant pop-up opens:

Enter the instrument symbol in the first box; otherwise, if the symbol is not recognised, you can use the Symbol Search by clicking on the magnifying glass icon. The button with the double arrow confirms the data, displaying the description of the instrument in the central part of the pop-up.
You can then enter the quantity that you require to appear by default in the order entry window, the intraday or overnight margin on derivatives that you wish to use and finally the minimum quantity of shares with which you wish to vary the initial order in the quantity column of the description cell. The <X> key deletes the values entered in the corresponding row.
You can also set the general minimum quantity valid for all securities and derivatives excluding the 10 securities you have already set:

Book Trading is an option that allows you to speed up filling in the Order Entry window. You can copy the quantity plus the price for a specific book level by simply clicking on the quantity, or you can copy the quantities present on several levels of the book.
This is in addition to the normal integration between Book and Order Entry, where the price is automatically copied into the Order Entry window with a single click on the Book price.

Vertical Book
By activating the anchor to the last price, the "last" price will always remain in the middle of the window in the vertical book.
Trading
This option allows you to set pre-defined trading on derivatives.
You can choose between intraday and overnight margin trading.

Close Orders Notice
This option allows you to be notified when several orders are entered on the same instrument within a short space of time.

You can define the PIN confirmation frequency in the same section: the PIN can be requested for each transaction or only the first time. If you choose the second option, it will be valid until PowerDesk is open: closing PowerDesk means that the PIN will need to be re-entered for the next new order:

> Watchlist
By opening PowerDesk, you will notice that the platform is already pre-set with some lists of securities (share baskets, Italian and foreign futures, bond baskets, Forex, Options and CFDs on Indices) which show specific contents. To change the order or the contents of the securities lists, you can use the window in this section of the Preferences:
By clicking on the contents of the three boxes to highlight them, you can organise the contents of the individual lists:
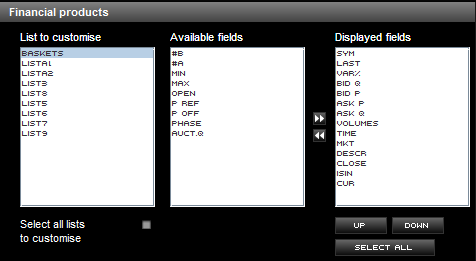
To reorganise the columns in your Watchlist without changing their contents, you can use Drag and Drop directly on the platform. In order to use Drag & Drop, simply select the label of the column you wish to move and drag it with the mouse to the desired position.
Selecting the Phase field allows you to view the parameters of the various market phases provided by the Borsa Italiana (LSE Group) market trading service:
| Parameter | Description |
| ACO | Opening auction |
| ACC | Closing auction |
| CNT | Continuous trading |
| PXO | Volatility auction due to lack of validation of the theoretical auction price |
| PXIN | Pre-volatility auction during continuous trading |
| PXI | Volatility auction |
| INI | Service opening or pre-trading |
| FRC | Period of inactivity during the closing auction |
| CLS | Market closure |
| ADM | Service administration phase |
| VWP | Last 10 minutes of the continuous trading phase |
| EOD | Service closure |
In addition, you can select the function to be displayed at the end of each security string, choosing from: Chart, Covered warrant, Vertical Book or PowerBoard.

To delete the securities included in a customised list, simply select the name on the list and click on the button:
<Delete> button:
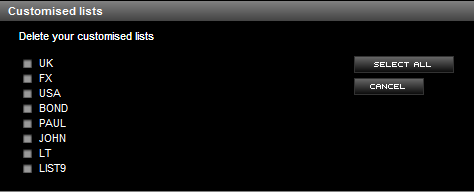
To delete all the contents of all the securities lists, first click on the <Select all> button and then on <Delete>.
Finally, you can define the content of the options list columns:

> Screen
In PowerDesk you can download screen and portfolio data as an Excel file or in a csv format, setting the directory for saving the data.

You can also define the number of days to be displayed in the order screen.

The orders status can also be customised in the order screen, whose visibility can be increased by colouring the background.
> PowerBoard
PowerBoard consists of 4 sections: Book, News, Screen and Chart. You can choose which sections to activate from this preferences area. Note: PowerBoard is programmed to be a modular mini-platform, therefore, when it is opened from PD2, its sections can be activated or deactivated independently from the settings given in the Preferences.

You can also choose the pre-defined size to open PowerBoard.

Market Bar
Market Bar is the fully customisable ticker with push notifications. It can contain financial products chosen among Shares, Futures, Indices and Currencies.

The security performance information displays the last price and the percentage change in relation to the previous day’s closing. Click on the security symbol to open PowerChart.
Watchlist
The PowerDesk watchlist consists of pre-defined baskets, eight customisable lists and the Best & Worst function. The market baskets are divided into:
- UK shares (Ftse100, Ftse 250)
- US shares (Dow Jones 30 and Nasdaq100)
- European shares (France, Germany, UK, Spain, Switzerland, Portugal, The Netherlands and Finland)
- CFDs on Indices
- Futures (Idem, Eurex and CME)
- Bonds (MOT and TLX)
- Forex
- Options.

Each customisable list can contain up to a maximum of 50 products including Shares, Bonds, Futures, ETFs, Options, CWs, Currencies and CFDs, without any restriction.
The Best-Worst function is located next to the last customisable list.

This function allows you to create lists of securities ordered according to:
- the best or worst percentage variation;
- the higher or lower equivalent values;
- the higher or lower volumes.
You can choose to compare all the securities on the markets available on PowerDesk or you can use the Country, Market or Type filters for more specific searches.
By clicking on the relevant arrow in each row  , the security details will be displayed, whose description can be found in the dedicated section.

Each security row displays a button (customisable from the preferences panel) which opens:
- PowerChart, the technical analysis chart relating to the security
- CW, the list of Covered Warrants of the security (this is only present if the security is the underlying of a CW)
- PowerBoard, the modular platform of the specific security
- Vertical Book
These functions can be activated by right-clicking the mouse:
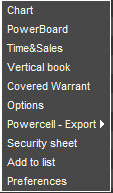
To add an instrument to the customised list, you can use the keypad located at the bottom left of the platform:

By entering the symbol or the name in the security field and you can enter the desired instrument in the customised list immediately, selecting it from the specific drop-down menu.
If you do not know the symbol/name, simply click on the button marked by a magnifying glass  which opens the full search pop-up (working details of the search function are given in the paragraph). When you have found the symbol, simply click on the button in order to add the corresponding instrument to the list
  .
.
The new instrument will be entered at the bottom of the selected customised list.
Moreover, to copy several instruments in one of the pre-defined lists, just open the pre-defined list, keep the CTRL key on the keyboard pressed and use the mouse to select the rows (i.e. the instruments) that you wish to copy. Or press the Shift key and drag the mouse to select up to 15 consecutive rows. The symbols appear inside the cells at the bottom of the Watchlist.

Then select the list on which you wish to copy the symbols and click on the <Add> key  .
.
- To remove a security from the customised list, simply select the securities you wish to remove, press the CTRL key and drag the mouse and then click on the <Delete symbols> button
 . The button can be found either at the top right of the platform or at the bottom of each customised list. In the same way used for adding symbols, you can use the CTRL and SHIFT keys to make multiple selections.
You can also cancel the contents of several Watchlists at the same time with just a few clicks in the Preferences window, in the dedicated Watchlist section. - To move securities press the CTRL key and select the securities, then use the <Move symbols> buttons
 . By clicking on the arrows, the securities will be moved up or down.
 - To reset each selection, use the <Reset>
 button, which deletes the selected securities displayed at the bottom of the Watchlist.
 - To assign a name to each customised list simply right-click the mouse on the header (e.g. List 10) and enter the name.
- To change the order of the columns in the Watchlist, use Drag and Drop or open preferences in the Watchlist section.
- To sort the rows according to the most appropriate criteria, click on the column header with the arrow. The columns which can sort new rows are: market, symbol, percentage change, volumes and time.
NOTE: All the changes made to the Watchlist will be saved automatically.
Watchlist Duplication
This function allows you to duplicate the Watchlist panel in order to view more than one list at the same time.
You could double the Watchlist just once from the main one.

Symbol search
You can access the securities search in PowerDesk by using the button  .
.
The top row of the window displays commands which allow improved filtering of the search. To find a symbol you should:
- Indicate the type of instrument that you are searching for: Shares, Indices, Derivatives and Currencies
- Enter the name or symbol through which you want to search in the first field
- Select the symbol or name filter
- Trading market: MTA, Milan MCW, NYSE, Nasdaq, Amex, France, Germany, The Netherlands, Portugal, Spain, Switzerland and United Kingdom
and then click on the <Search> button  .
.
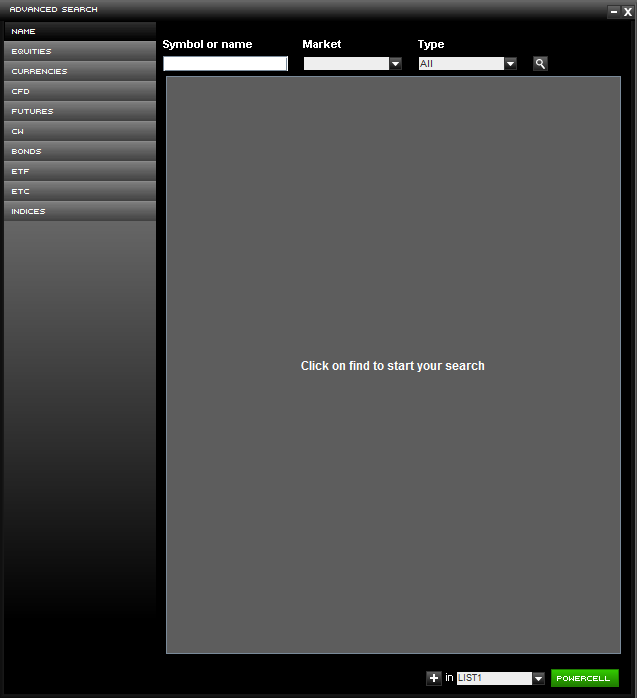
If the symbol is not unique, the search provides a list of instruments. However, if the symbol is unique, you need to select the instrument in the list and click on the <Add> button  in order to add the instrument to the customised Watchlist or on <PowerCell> in order to copy the master record of the instrument into Excel and use it for dynamic updates through DDE.
You can search by product (shares, currencies, CFDs, futures, CWs, bonds, ETFs, etc. and indices).
If you are searching for derivatives and currencies, the search is easier: for example, by selecting "Derivatives" the search immediately returns all the futures, present at that time.
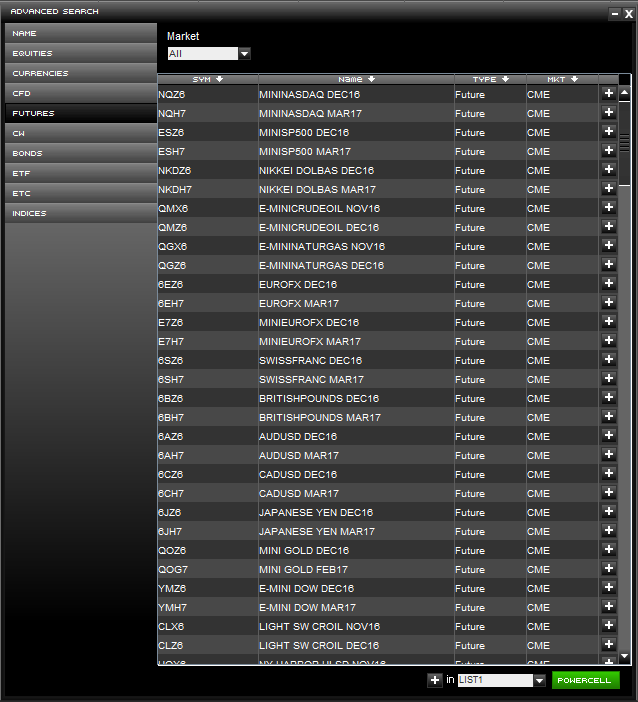
Security details
To view the details of a security, simply click on the button with the arrow at the start of each row in the securities lists.
The central part of the expanded row contains the order entry screens, concerning which there is a specific paragraph (Trade View and Conditional Orders).
The two equal-sized side-by-side and modular sections can contain Book, Tick by Tick or Spread Bid & Ask Charts, Screens, News and Time & Sales. Every detail can be customised by clicking on the vertical label at the left of each section:
- The Book displays in real time the five best bid and ask price proposals on the market. The Book is always connected with the order entry window. To activate the Trading Book and increase the level of integration between the Book and the order entry screen, simply open "Preferences" and set its details.
- The Screen records all orders on the security entered during the day. It is divided into tabs according to the trading permitted on the instrument: securities if the details are for a share, Derivatives trading for Futures.
- The tick-by-tick chart is built on the Last price or on the updated bid/ask Spread, with push notifications when the Book is updated.
- News is filtered for the specific security. To read the full text of the news item, just click on the title and open the pop-up.
- Time & Sales is the table that allows you to see all the contracts exchanged on a security.
To go back to the compact mode of the details row, simply click on the button again.
Indices
Indices The most important national and international indices are updated in real time: symbol, last price, percentage change in respect of the previous day’s closing, day maximum and minimum and minute of the last update.
There is also a thermometer which tracks index performance: the distance of the last quote from the maximum is given in red, in green from the minimum, and the triangle indicates the day’s opening. Click on the symbol to open the technical analysis chart.
When PowerDesk opens, this information block is in the bottom left panel: to move it, you need to open the preferences window in the general section.
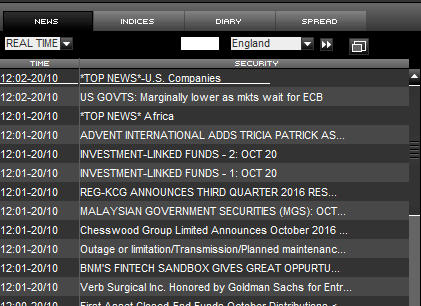
News
News is provided by Reuters, MF Dow Jones News in real time. Click on a news headline to open a window with the full text.
To filter news, enter the symbol in the specific "SYM" box and click on the button. In the security details and in PowerBoard the filter on the financial instrument has already been applied.
When PowerDesk opens, the general news is in the bottom left panel: to modify it, open the preferences window in the general section.
Spread
The Spread view shows the 10-year yields of the main global government bonds.
The spread value represents the difference in index points between the two bonds.
The %var indicates the increase or decrease of the spread since the previous day (close).
Minimum, maximum and open refer to the current day.

Best&Worst/Ranking
You could access the Best & Worst list  by clicking on the corresponding button to the right side of the custom lists.
This function allows you to update financial instruments ranking, based on the following criteria:
- Daily percentage change - Best / Worst
- Daily values - Greatest / Lowest
- Daily volumes - Greatest / Lowest

For each list, the first 100 results are shown.
The list is updated dynamically and it automatically orders financial instruments according to the selected criteria, as well as by the country, the market and the type of instrument.
The dynamic ordering allows adding in the ranking also instruments which are not part of the initial 100.
If you expand a row concerning a single instrument (so-called Expanded row) the Ranking will be deactivated.
Click on the "Ranking on" button to reactivate it.
A column shows green / red triangles indicating the shift of the instrument: if the security shifts up in the ranking list, a green triangle appears and a red triangle will be shown for instruments that have come down accordingly.
For the proper functioning of the Best&Worst list you need to be subscribed to the push information on all markets.
For financial instruments listed on markets for which you have subscribed for pull or delay information, the list is updated dynamically however quotes and changes are not updated real-time.
Best&Worst is available only during trading hours. If you select a closed market, an error message showing “No security found” will be displayed.
Heikin Ashi
Heikin-Ashi is a type of trading chart that originated in Japan.
Normal candlestick charts are composed of a series of open-high-low-close (OHLC) bars set apart by a time series. Heikin Ashi charts calculate their own open (HAO), high (HAH), low (HAL) and close (HAC) using the actual open (O), high (H), low (L) and close (C) of the time frame as follow:
1. The HA close price is a sort of average of the open, high, low and close for the current period
HA-Close = (Open + High + Low + Close) / 4.
2. The HA Open is the average of the prior Heikin- Ashi candlestick open plus the close of the prior Heikin-Ashi candlestick.
HA-Open = (HA-Open [-1] + HA-Close [-1]) / 2.
3. The Heikin-Ashi is the maximum of three data points: the current period’s high, the current Heikin-ashi candlestick open or the current Heikin-Ashi candlestick close.
HA-High = Maximum of the High, HA-Open or HA-Close
4. The Heikin-Ashi low is the minimum of three data points: the current period’s low, the current Heikin-Ashi candlestick open or the current Heikin-Ashi candlestick close.
HA-Low = Minimum of the Low, HA-Open or HA-Close
Heikin Ashi Charts are also color coded, like candlesticks, so as long as the price is rising (based on the calculations) then the bars will show up as green. As long as the price is falling (based on the calculation) then the bars will show up as red.
Heikin Ashi chart is available by clicking on the icon  between chart icons with the following label: “Heiken Ashi (F8)”

“Ichimoku” Indicator
Ichimoku is a moving average-based trend identification system and because it contains more data points than standard candlestick charts, it provides a clearer picture of potential price action. Ichimoku translates to one glance the chart and it defines support and resistance, identifies trend direction, gauges momentum and provides trading signals.
The key elements of Ichimoku’s Graphic Envirorment:
Tenkan-sen – Turning Line: is derived by averaging the highest high and the lowest low for the past nine periods.
Tenkan-sen = (highest high + lowest low)/2 for the last 9 periods
Kijun-sen – Base line:
Kijun-sen = (highest high + lowest low)/2 for the last 26 periods
Chinkou span – Lagging line:
Chikou span = today's closing price projected back 26 days on the chart.
Senkou span A – First leading line
Senkou Span A = (Tenkan-sen + kijun-sen)/2 plotted 26 periods ahead.
Senkou span B - Second leading line
Senkou span B = (highest high + lowest low)/2 calculated over the past 52 time periods and plotted 26 periods ahead.
Senkou span A and Senkou span B form the edge of the kumo (cloud). The cloud edges identify current and potential future support and resistance points.
If the price is above the cloud, the top line serves as the first support level while the bottom line serves as the second support level.
If the price is below the cloud, the bottom line forms the first resistance level while the top line is the second resistance level.
Generally, markets are bullish when Senkou Span A is above Senkou Span B and vice versa when markets are bearish.
The Tenkan Sen is an indicator of the market trend. If the Tenkan-sen line is moving up or down, it indicates that the market is trending. If it moves horizontally, it signals that the market is ranging.
The Kijun Sen is a support/resistance line, and can be used as a trailing stop line. The Kijun Sen acts as an indicator of future price movement. If the price is higher than Kijun-sen line, it could continue to climb higher. If the price is below the Kijun-sen line, it could keep dropping.
Periods 9, 26 and 52 are set as default, but you can change them by clicking on the indicator name in the chart window.
PowerBoard
PowerBoard is an independent platform where you can also change the symbol directly. PowerBoard is integrated with the platform and the Preferences you have set. To open PowerBoard, click on the  button in the security row in the Watchlist (if set as a function to be displayed in the security row) or right-click the mouse and choose PowerBoard from the drop-down menu.
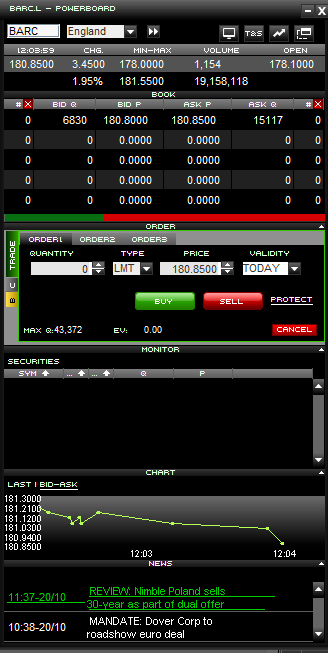
PowerBoard is modular and consists of 4 parts:
- The Book is always connected to the order entry window. To activate the Trading Book and increase the level of integration between the Book and the order entry screen, simply open "Preferences" and set its details.
- The Screen records all orders on the security entered during the day. It is divided into tabs related to the trading allowed on the security.
- The chart is tick-by-tick or bid/ask spread, updated with push notifications, when the Book is updated.
- News is filtered for the security. To read the full text of the news, just click on the news headline.
Each section described above can be deactivated by the arrow, located at the top right of each section, until you reach the security and order entry windows.
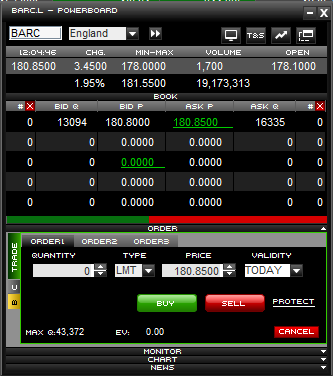
With PowerBoard all trading is in any case ensured even in the most basic section: ordinary, margin trading and on Derivatives, either through the displayed real-time information or through the two Order Entry screens: Trade View and window for conditional orders.
There are two methods to change the financial instrument:
- type in the symbol of the new instrument in the symbol entry area.
- drag the symbol from the Watchlist, screen or PD2 portfolio using Drag & Drop inside the PowerBoard window.
NOTE: you can open up to 50 PowerBoards at the same time if the computer meets the necessary requirements.
You can expand or shrink each PowerBoard simply by selecting the bottom right corner.
Vertical Book
The Vertical Book is activated by clicking on the ![]() button in the security row, or from the drop-down menu opened by right-clicking the mouse. 10 price levels are displayed when the Book is opened: 5 levels below and 5 above the last price. The quantity and number of proposals are indicated for the first 5 levels above and below the last price.
button in the security row, or from the drop-down menu opened by right-clicking the mouse. 10 price levels are displayed when the Book is opened: 5 levels below and 5 above the last price. The quantity and number of proposals are indicated for the first 5 levels above and below the last price.
The quantity and number of proposals for each level are displayed to the right and left of the central column. The first five bid and ask levels scroll up or down following the security’s performance. To enlarge or shrink the window, just select the bottom right corner and choose the preferred size.
In Preferences, you can select to anchor the last price in the centre of the window or to keep the price bar fixed, regardless of the security transactions.
Trading:
- Set the quantity traded and the trading type (standard, Intraday margin trading - Overnight margin trading).
- To buy, just click the mouse on a specific level in the Bid quantity column; to sell, just click on the fields of the Ask quantity column corresponding to specific price levels.
- By clicking on a price level above the last (in the Bid quantity column), a buy order is sent to market at the selected price; however, by clicking on a price level below the last in the Ask quantity column, a sell order is sent to market with the selected price.
- The first column on the left (ORDERS) is a useful screen that displays the quantities of the orders entered on the market.
- Just click on the quantities entered in the "ORD" column to cancel all orders entered in the market quickly.
- Under the book there is a screen in which you can follow the details of each order and cancel these if necessary.
The Vertical Book is an independent mini-platform on which you can view every security by dragging the symbol with Drag & Drop.
Important! By clicking on the quantities column, the order is entered immediately on the market, without a confirmation window.
Time and Sales
Time & Sales is the table that allows you to see all the contracts made on a security.
Time & Sales can be activated by clicking on the  button, therefore from the Vertical Book, PowerBoard and Order Entry in the expanded row of each security (by clicking on the button from the two side windows).
After activation, the individual trades are gradually displayed showing the time, price, quantity and change from the previous contract.
To avoid excessive consumption of the PC’s memory, by default the table shows up to the last 10 trades made. Using the specific drop-down menu at the bottom, you can choose to display up to the last 1000 contracts.
Time & Sales is developed in a pop-up which can be expanded as desired from the bottom edge. The instrument is totally independent from the security from which it was activated and is automatically updated even when working on other instruments or markets.
Price alerts
The Alert service advises you when a security in the Portfolio or one that you are monitoring reaches a certain price level. You can therefore monitor securities even when you are not in front of your computer. You need to configure a condition (e.g. "If the price of the ABC security drops below 3.2 Euros"), enter the date by when the event has to happen and indicate how you want to be alerted: By pop-up, email or Texts. Moreover PowerDesk allows you to write a short message which will be sent to you with the alert.
There are 30 price alerts available in PowerDesk. Setting an alert directly from the dedicated "Alert" screen is very easy:

- Type in the symbol in the cell
- Set the event: i.e. the price must be higher than, higher than/equal to, less than or less than/equal to a specific reference price
- Define the validity of the alert
- Select the way you want to be alerted of the event’s occurrence
- Define a message (maximum 50 characters) that you want to receive at the same time as the alert message
- Activate the row in the ON column.
You can set an alert for a price being reached on any UK or international security.
NOTE: thanks to the (ON/OFF) option on the platform, you can pre-configure alerts and activate them only at the appropriate time. You can link the alert to automatically enter an order, by setting a conditional order (see the relevant paragraphs for the details).
Acoustic alert and pop-ups
You can select the two functions from the securities screen header by using the two dedicated buttons  . If the two icons are crossed out, the functions are not active
  .
.
By clicking on the bell button you can receive an acoustic alert for every executed order.
Whereas, by clicking on the left-hand button, each time an order is executed, a pop-up opens reporting all the details of the executed order.
When both functions are activated, the acoustic alert sounds at the same time as the summary pop-up appears.
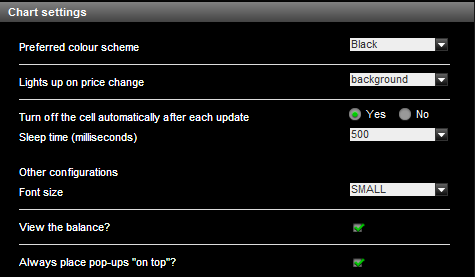
Chart customisation
You can personalise some of the platform’s graphic elements from the PowerDesk Preferences panel:
- the character size choosing from three different pre-defined sizes: large, medium and small
- the background colour and each price update highlight
- "always on-top": by flagging the function, each pop-up that opens will always appear on top
Expandable monitor and portfolio
The order monitor and portfolio can be expanded by selecting and dragging the edge of each panel sideways.
Ranking
By clicking on the  button, you can dynamically sort (with push notifications, at each price change) the securities in each list. For example, you can sort the securities by percentage change or by the time of the last price (in this case you can decide to show the security that was last traded on the top row of the list).
WORKSPACE
Using the  function you can create a completely customised workspace. By activating the workspace the main components are broken down into single panels, whose shape and size can be managed according to your needs.
By clicking on the  button a pop-up opens with the choice of the modules you wish to view:
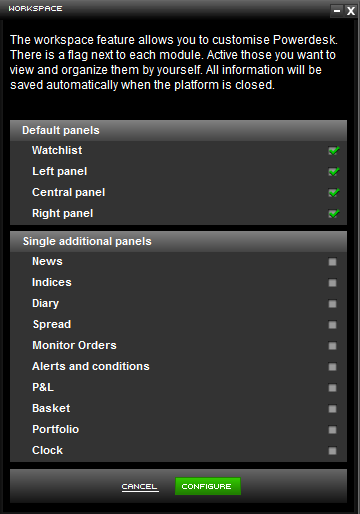
DEFAULT PANELS:
- Watchlist: contains the 8 customised lists, pre-defined baskets and management bar
- LH multifunction panel: the content of this panel can be customised from preferences.
By default it contains the News, Indices and the Spread view. - Central multifunction panel: it consists of the screen, the "alerts and conditional orders" section, the P&L and the BASKET.
- RH multifunction panel: the content of this panel can be customised from preferences.
By default it contains the Portfolio
SINGLE ADDITIONAL PANELS:
- by selecting one or more single panels, you can duplicate the functions inside the "default panel" macro groups.
Inside each panel there is a "duplicate" button which allows you to add an additional panel of the single section  ; in this way for example you can create more than one portfolio or several order screens.
- When clicking on this button
 the platform is broken up, and additional panels are created in the centre.
The single panels can be reduced to icons by using the  button. All the components can also be minimised using the same button
  on the control bar at the top of the platform:

The workspace also allows you to use several screens, managing all the panels as individual platform structures.
Note: When you close the platform, you will be asked whether you want to save the changes made.

The changes are saved on the Fineco server so you will be able to access the customised PowerDesk regardless of the PC you are using.
In any case, you can restore the default version at any time from the Preferences panel.
To return to the "Fixed" or standard structure, just click on the  button and confirm by pressing.
If you want to recreate the standard structure, without losing what has been saved in the Workspace, you need to uncheck automatic save in the platform closure pop-up. Otherwise, the changes will be overwritten saving the fixed structure.
Basket Order
Basket order is the Powerdesk tool that allows you to preset one or more orders and save them within one or more lists, reserving the right to transmit them, all or in part, to Fineco at a later time.
How does it work
- Order entering and saving
In the central monitor, in the expanded row of each title, there is a BASKET tab that allows you to create and save an order, without submitting it to the market.

Orders saved in the Basket are considered transmitted to Fineco for their execution only when, after being flagged, you click on the "SEND ORDERS" button and enter the PIN. Those orders will then be submitted to the market by Fineco.
Saved orders are displayed in the List as already flagged and at any time you can:
- transmit them to Fineco by clicking the "SEND ORDERS" button
- delete them by clicking the "CANCEL ORDER" button
Furthermore, by clicking on the row of each saved order, you can change it at any time:
- the sign: buy or sell
- the quantity
- the order type: at a limit price or at a market price
When a market order is saved (type=MKT) it is not possible to change it into a limit order (type=LMT); You will need to create and save a new order at a limit price.
By clicking on the "CANCEL ORDERS" button, all the selected orders will be deleted from the list. You could also cancel a saved order via the  button displayed next to each order.
- Protect  : this link allows you to enter / edit a Stop Loss, a Take Profit and a Trailing Stop on the order.
If you set a Stop Loss or a Take Profit, the button is reduced in size, showing the pre-determined price for the corresponding Stop and Take
Example of an order with no protection : 
Example of an order with a Stop Loss:  (the Stop is always shown on the left)
Example of an order with Take Profit:  (Take Profit is always shown on the right)
Example of an order with Trailing Stop:  (the protect button on the left appears lighter)
Saved orders can be viewed in a List in the BASKET Monitor and remain permanently stored.
In the list, the following information are available:
- SYM: Security symbol
- OP: operating settings (ORD: ordinary, In: intraday, Ov: overnight)
- BS: the sign of the operation (buy / sell)
- Q.TY: quantity
- PRICE: Market or Limit
- MARGIN: Selected Margin for orders on derivative instruments

Send an order
The last saved order is the first one that appears at the top of the BASKET List.
All saved orders are displayed in the List as flagged, ready to be transmitted to Fineco.
It is necessary to unflag the orders that you DO NOT want to submit to the market, afterwards you have to click on the “SEND ORDERS” button to transmit the selected orders.
If several orders are sent, the first to be transmitted to Fineco is the first at the top of the List, then the second and so on. However, you can change the order via the arrows  , moving the orders up or down the list; thus submitting to the market.

After clicking the "SEND ORDERS" button, a summary popup will be displayed for checking the order status.
In the "Orders Monitor" section, you can check the execution of orders and the relative execution price.
Basket order allows keeping track of the orders previously saved in the List and subsequently transmitted to Fineco. These orders will remain in the List indeed:
- if in the “basket order status” panel are figuring as “send”, they will be displayed as unflagged;
- if in the “basket order status” panel are figuring as “error”, they will remain flagged so that you could transmit them again to Fineco later.

Note: before sending orders to the market, we suggest you to check the correctness of all parameters and the sending sequence that you want to keep.
All orders are independent from each other. In case of multiple submissions, the refusal of one of them does not prejudice the transmission of the other orders requested to be sent.
Multi Basket
Due to BASKET1, BASKET2, BASKET3 you could manage your orders in 3 different panels.

Clicking on SAVE, a confirmation of the order transmission is given via a pop-up:
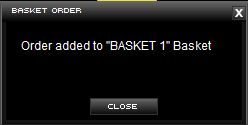
By adding an order from the “Basket 2” tab, for example, the order will be displayed in the central Basket 2 panel, as shown below:

Up to 3 different Baskets can be saved. You can delete all orders added to one basket just in one click or you can rename a Basket by using the  icon:
icon:
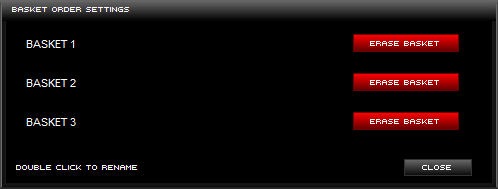
If you want to rename a basket, simply click twice on the word “Basket”

Note: The "ERASE BASKET" button deletes all orders saved in that basket, as well as the customized name.
Futures trading
> What is a Future?
The derivatives consist of a standardised forward contract, for the purchase/sale of a commodity or financial asset (underlying) at a future date, at a price fixed at the time the contract is agreed.
The parties signing a Futures contract undertake to trade, on a pre-established date and at a price (Futures Price) defined by the contract, the amount of financial instruments or of a specific asset underlying the contract, whose price is formed on the related market. Investors purchasing a Futures contract have a long position; they must buy the asset underlying the contract on expiry, or they can close their position by selling a Future which is equivalent to the purchased one before expiry. Likewise, investors selling a Futures contract have a short position and undertake to deliver the underlying asset on expiry, or they close their position before expiry, by purchasing a contract which is equivalent to the one sold. An increase in the price of the Future generates profit for investors that have a long position, and losses for investors that have a short position.
> Clearing margin
Futures trading is characterised by the so-called margins system, according to which investors entering into a Futures contract must deposit, through an intermediary called the Clearing Member, a sum of money (initial or clearing margin), in order to guarantee performance on expiry. The margin is a limited percentage (which varies from 2% to 30%) of the traded amount.
Fineco allows you to customise both the level of the clearing margins held and the positioning of the related Stop Loss order (always 5% lower than the clearing margin). If the clearing margin is set at 20%, with the Stop Loss order at 15%, this level can be changed directly on PowerDesk, using the drop-down Margin Trading menu in the order entry screen, increasing the margin level up to 30% with a stop at 25% or reducing it to 2% with a stop at 0.5%, for "tighter" trading.
Margins can therefore be changed, provided your derivatives portfolio does not already have open positions on that specific Future.
> Fineco’s Automatic Stop Loss
This is an automatic order that closes your position if the price undergoes excessive variations. The Stop Order varies according to the traded instrument, the type of trading and the selected margin.
The Automatic Stop Order is triggered when the underlying instrument (and not the margin) varies by a percentage equal to: Margin% - 5%. For example, with a Margin fixed at 20%, the Automatic Stop Order will be triggered if the underlying index (e.g. FTSE MIB) varies by 15% (= 20%-5%). For the purpose of this calculation, the reference value used is the average price of the executed orders. At the end of the day, if there are open positions, the Stop Order value will be reintroduced the following day, still calculated on the average of executed orders, whereas the closing value at the end of the day will be used for margin adjustment transactions and for subsequently calculating profits/losses at the closure of the contract. This Stop Loss cannot be changed by the customer.
It is possible to enter a Stop Loss with a "tighter" price level and a Take Profit on the position, but not a Trailing Stop.
> Stop Loss, Take Profit and Trailing Stop
Automatic orders (Stop Losses, Take Profits and Trailing Stops) can be entered on the single orders making up the position.
> Settlement
The settlement or official closing price is calculated daily for each Futures contract and is displayed in a specific "Settlement of Futures" table in the Portfolio page of the website.
After closing of the Idem, Eurex and CME markets, all settlement prices that are used to calculate the margin and accounting positions are updated.
Note: each stock exchange can establish different procedures for calculating the official closing price.
> Multiplier/Minimum lot
For index products, the multiplier is the value in Euros of each index point. For futures, the minimum lot refers to the number of futures contracts covered by the order.
> Accounting and administrative note
Trading on derivatives is recognised at T+1, while the Euro/Dollar exchange rate has a value date of T+3.
Therefore, a currency request to trade US futures guarantees available funds for trading. Whereas, for open Overnight positions, the account could become overdrawn because of the different recording of exchange and derivatives transactions.
Entering an order
You must enter the following in the order screen:
> Quantity: the number of lots you wish to buy/sell.
> Type: indicates the type of order:
- "MKT" market.
- "STF" at best or sweep to fill.
- "LIM" limit.
> Price: the buy/sell price of a contract.
> Margin: the clearing margin.
> Validity: you can choose from three different methods to enter the order:
- GTC: Good Till Cancelled. It allows you to enter an order that is valid until the end of the trading day. This parameter is pre-set in the order window.
Note: Stop Loss orders cannot be entered without a price limit. - IOC: is the abbreviation for "Immediate or Cancel". It allows you to enter an order, at a specified price, that will be executed (possibly partially) at the time that it is entered. Any quantity not met at the set price will automatically be cancelled.
Note: Stop Loss orders cannot be entered without a price limit. - FOK: fill or kill. The order must be executed in full or it is automatically cancelled.
It allows you to enter an order with a price indication, which will be executed only if the book contains enough to cover the quantity in full; otherwise the entire order is automatically cancelled. This type of order is not accepted by Eurex.
Note: Stop Loss orders cannot be entered without a price limit.
IOC and FOK orders are never entered in the book (despite generating a PDN).
Validity of market orders
For derivatives traded on IDEM, a market order can be associated with an IOC or FOK validity.
For derivatives traded on Eurex, this type of order is restricted to a GTC validity.
Market orders on Futures traded on the CME can be GTC or IOC.
> SL – TP: automatic orders (Stop Losses, Take Profits and Trailing Stops) can be entered both on orders and on positions.
Operating notes:
- Every order on derivatives must be executed on the same market day. Otherwise it will be cancelled.
- The rollover (lengthening the position beyond expiry) must be performed manually by closing out the contract prior to the upcoming expiry date and then setting up the same position rolled over to the next expiry date. All the positions still open on the expiry date will automatically be closed.
- You can enter orders at a price close to the automatic Stop Loss, but there could be sudden market movements, and the possibility that both the order entered and the Stop Loss are executed, producing the effect of opening a new position with opposite sign.
- The default quantity for orders on Futures can be pre-set in the PD2 Preferences. This allows filling in the Order Entry screen more quickly.
Cancelling an order
To cancel an order, the order status must be, “in the queue, to be queued or partially executed”. It is cancelled by clicking on the specific button  in the Derivatives Order Screen.
If the order is entered, in the queue or to be queued, by clicking on the cancel button, the command has effect on the entire equivalent value of the order.
If the order has been partially executed, clicking on the  button only cancels the non-executed part of the order.
When an order is cancelled, the funds reserved for the transaction are immediately credited back to the available balance.
As occurs with the other instruments that can be traded on PowerDesk, both individual orders and all orders entered on a future can be cancelled from the book through the cancel functions.
Repeating an order
An order can be repeated at any time provided the order to be repeated has been executed. Repeat an order by clicking on the specific button  in the Order Screen.
NOTE: as the linked conditional order is an active order, clicking on the <Repeat> button also repeats the order.
Closing a position
Derivatives trading allows you to close a position by entering a sell order for the same security. The sell order can be filled in either in the order entry screen in the security details, or in PowerBoard and the derivatives Portfolio. Moreover, still from the Portfolio, you can enter a market order by clicking on the "C" button in the Close column.

Closure can be partial or total according to the quantity of securities you wish to sell.
Derivatives trading not only allows you to close the position but, at the same time, to reverse the position by entering a larger quantity in the order.
Entering Stop Loss, Take Profit and Trailing Stop conditions
> Automatic Stop Losses
Fineco automatically associates a Stop Loss to each open position. This Stop Loss varies according to the traded instrument, the type of trading and the margin selected. The Stop Loss is a "market" order, which automatically closes your position if the price undergoes excessive variations.
To display the automatic cover price, click on the  button by the position string in the futures screen. Clicking opens a box which shows the automatic cover value in detail.
> Customised Stop Losses and Take Profits on the position
You can enter a Stop Loss with a "tighter" price level than the automatic Stop Loss and a Take Profit in the same box which shows the Fineco Stop Loss. It is not possible to enter any Trailing Stops on the position.
These automatic orders can be sent either with a "market" or with a "limit" price.
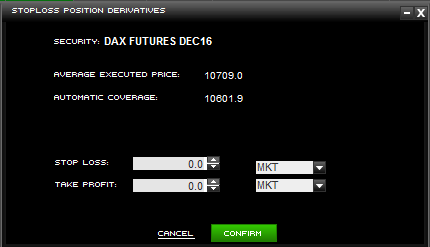
> Customised Stop Losses and Take Profits on the order
Customisable automatic orders such as Stop Losses, Take Profits and Trailing Stops can be entered in addition to the automatic cover price. They can be entered:
- during the order entry phase by clicking on the specific link (in this case the order entry screen expands offering the option of entering an SL, TP or Trailing Stop)

- or they can be entered after entering the order by clicking the
 button by the order string in the futures screen.
You need to enter the two values on which you want to place the Stop Loss and Take Profit and the number of ticks for the Trailing Stop.
The potential Profit or Loss calculator is located next to each value entered.

The personalised Stop Loss cannot be less than the Fineco automatic cover price for long positions and cannot be higher in the case of short positions. The system allows you to enter Stop Loss higher than the average carrying value and lower than the market price of the position. This enables you to protect any gains, updating the Stop Loss value to the market value taken by the position.
After entering one of the values, the specific button lights up (bright blue) indicating the presence of at least one of the automatic orders. To edit the values entered, simply click on the arrows of the related box and click on confirm; to cancel the values entered just click on the "x" button.
Revocation
Fineco will consider the SL and TP and TS values lapsed if:
- one of the three conditions occurs and the order is therefore sent to market
- should the position be reversed, the values entered on the individual orders remain valid; however, any SLs and TPs entered on the position lapse. The stops must be entered again in order to protect the position.
Remember that Trailing Stops are valid for one day; any active Trailing Stops will be cancelled at the end of the continuous trading phase.
> Protect  : this link allows you to enter/edit Stop Loss, Take Profits and Trailing Stops on the order.
If a Stop Loss or Take Profit is entered, the size of the button is reduced, showing the predetermined price for the corresponding Stop Loss or Take Profit
Example of an unprotected order: 
Example of an order with a Stop Loss:  (the Stop Loss is always shown on the left)
Example of an order with a Take Profit:  (the Take Profit is always shown on the right)
Example of an order with a Trailing Stop:  (the protect button on the left is a lighter colour)
Trade and Reverse
This function allows traders to reverse their position on the market with a single click, as it enables completely closing the long or short position on Futures and opening a position with the opposite sign with a single order.
Trade & Reverse cancels any Stop Loss and Take Profit entered on the position, but it does not modify the conditions placed on the single orders which remain active.
Bid and Ask Orders
It is possible to be present in the Book at the same time with several buy and sell orders on the same future. Bid & Ask Orders are active on CME, Eurex and IDEM Futures.
Derivatives Order Screen
Derivatives transactions are characterized by setting up a position containing all orders on the same instrument regardless of the opening date of the position.
In the Derivatives screen, the top row refers to the position on the instrument, whereas the expanded top row shows the details of all the orders which constitute it.
1. The following are displayed in the header:
> In the top drop-down menu, the number of trading days ("dd") for which you wish to view the orders entered (please note that 0 days corresponds to the last 24 hours of trading).
> The "Status" drop-down menu allows you to filter the orders in the screen according to their status.
2. The Screen columns contain:
- "SYM": Symbol of the Future.
- "ST": Order status: the information provided by the market concerning the execution status of the order at that point in time. This status can be:
- Executed
- Partially Executed
- Entered
- Cancelled
- Refused: the order was refused by the system or by the Market. There could be various causes, including: a lack of liquidity (in the case of a buy order) or of securities (in the case of a sell order); any other reason why the order cannot be executed.
- In the queue
- To be queued. The order has been taken up. It will be placed on the market as soon as the market starts accepting new orders (this usually happens when the market is still closed).
- "B/S": indicates whether the order is Buy or Sell.
- "ENT.Q": Quantity entered in the order.
- "ENT.P": Price entered in the order.
- "EXE.Q": Executed quantity of the order.
- "EXE.P": Executed price of the order.
- "COND": if there is a conditional order.
- “DATE”: The Date and Time the order is placed and any quantity executed, even partially.
> Order management column:
- Cancel Order: there is a button next to each non-executed or partially executed order; simply click on the button to send a command to withdraw the order.
- Repeat Order: to re-enter an order, just click on the button and the order will be sent to market with the same characteristics as the original order.
- SL – TP: to set a Stop Loss, Take Profit and Trailing Stop on each individual order or, when by the position line, to allow you to set a Stop Loss and Take Profit on the position.
NOTE: the Order Code indicates the unique number assigned to each order: by clicking on the order status, you can see the order certificate, which can be printed for your own records.
3. You can set a further filter on the orders shown by entering the security Symbol and clicking on Filter at the bottom of the Screen.
Derivatives Portfolio
The portfolio allows you to view your Futures position in real time, at any moment.
Some information is shown for each security:
- "SYM": the symbol of the contract on which a position is open.
- "QTY": Quantity of the position, i.e. the number of lots and the position sign ("-" indicates a short position).
- "Theoretical P&L": updated profits or losses on the open position; the value indicates how much the customer would gain or lose if he closed the "market" position at that point in time
- "CLOSE" instruction column
- "AVERAGE.P": the average carrying value indicates the price at which the securities were bought. From the day following the purchase, the price also includes paid fees.
- "MKT.P": indicates the market price updated in real time.
- "% Var": expresses the difference between the average carrying value and the market price.
- "Car Val": indicates the total value of the derivative at the time of purchase
- "Mkt Val": indicates the value of the derivative in real time
- "Cur": the currency in which the financial instrument is traded
- "Mkt": indicates the traded product (fut = futures)
Operating Note: the Profit & Loss value, which follows a cover, is calculated in relation to the average price (the lots are covered taking into consideration their average price). The average carrying value of the lots changes from day to day in relation to the compensation with the clearing house.
Conditional orders
The customer can enter up to 30 conditional orders (Stop Losses or Take Profits) on PowerDesk. In this case also, the Customer’s order is not shown in the book until the Condition Price is reached.
As conditional orders on derivatives are sent and handled by the reference markets, each market has different operating rules for accepting conditional offers.
For the same reason, once this type of order has been entered, it does not appear in the special Conditional Order Screen, but it is included in the Derivatives Order Screen.
Each market has different rules for accepting conditional orders:
> EUREX: this market has very restrictive rules for accepting conditional orders.
- Condition: the last price is the same as the reference price.
- Order: the order price is the same as the condition price (the price field is not active): the conditional order is triggered when the market reaches a key price and sends an order to market at that price.
Moreover, a conditional buy order is accepted if the reference price is higher than the Last price, whereas a conditional sell order is accepted if the reference price is less than the Last price.
> CME: this market has some rules for accepting conditional orders.
- Condition: the Last price is the same as the reference price.
- Order: there is no inextricable link between the trigger price (the condition price) and the price that is then sent to market, therefore they may be different. The order type can be either "limit" or "market".
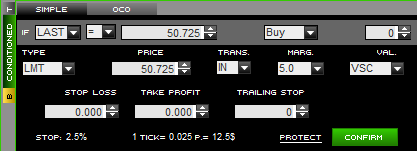
Operating note: Conditional orders have a one-day validity and, if not executed, the conditions associated with them (Stop Loss, Take Profit or Trailing Stop) will be cancelled on expiry of the order.
> IDEM: this market offers great flexibility for setting conditional orders.
- Condition: the last price can be more than/equal to or less than/equal to the reference price.

- Order: there is no inextricable link between the trigger price (the condition price) and the price that is then sent to market, therefore they may be different. A price limit must be entered.
> OCO orders can be entered on the IDEM, Eurex and CME markets.
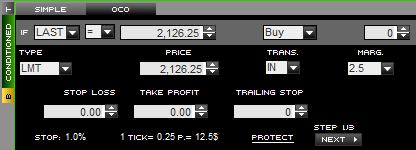
Trading on Options
> What is an option?
Options are derivatives financial contracts that give the holder the right, but not the obligation, to buy (in which case the option is known as a CALL) or to sell (in which case the option is known as a PUT) a specific underlying instrument (which can be a share, an index, a currency, etc.) at a set price (known as the STRIKE PRICE) in return for the payment of a premium.
The Option is defined a EUROPEAN TYPE if the right can only be exercised on the expiry date; if on the other hand it can be exercised at any time up to the expiry date, the Option is defined an AMERICAN TYPE.CALL and PUT Options can be bought or sold, thereby obtaining very different return profiles.
> Some definitions
Underlying: The underlying financial instrument can be a share, an index, a currency, a government bond, a future contract or any other transferable security (e.g. Fiat, FTSE MIB, Dollar/Euro) for which it is possible to identify official prices.
Contract multiplier: If the underlying instrument consists of an index, a monetary value is attributed to each of its units. In the case of Options on the FTSE MIB, each point has a value of 2.5 Euros, on the DAX index each point has a value of 5 Euros and on the EUROSTOXX50 the value of each point is 10 Euros.
Contract size: The contract size is given by the product of the value of the strike price (in index points) and the value of the contract multiplier.
Premium: This is the price paid by the investor on acquiring the Option and represents the maximum loss that he/she can incur. The equivalent value invested is equal to the option’s premium (expressed in index points) multiplied by the contract multiplier (2.5 Euros in the case of options on the FTSE MIB index).
Strike price: The price of the underlying instrument at which the investor can exercise the option. Movements in the underlying instrument can modify the value of an Option and, according to its position in respect of the strike price, call options can be defined as:
- in the money: when the value of the underlying instrument is greater than the strike price;
- out of the money: when the value of the underlying instrument is lower than the strike price;
- at the money: when the value of the underlying instrument is the same as the strike price.
Conversely, put Options can be defined as:
- in the money: when the value of the underlying instrument is lower than the strike price;
- out of the money: when the value of the underlying instrument is greater than the strike price;
- at the money: when the value of the underlying is the same as the strike price
> Trading
With PowerDesk you can buy all the expiring Option contracts on the FTSE MIB Index traded on the IDEM market and all the expiring option contracts on the DAX and EUROSTOXX50 indices.
However, no short sale is available. In order to open a long position you must pay a premium, which is the maximum potential loss that the investor could suffer. If the position is closed before the expiry of the contract, the Option is traded on the market and the profit or loss on the position is calculated as the difference between the sell price and the carrying value.
For each maturity of options on shares and on the FTSE MIB index, trading is possible until the market closure (17:40) on the day prior to the end of each contract (usually on Friday mornings).
Each contract is displayed in the securities portfolio until the evening before the last trading day.
For options on the Eurex market, trading on each expiring contract ends at its maturity (usually the third Friday of the month).
Specifically, at 12:00 on the expiry date, for options on the EUROSTOXX50 index and at 13:00, also on the expiry date, for options on the DAX index.
Trading on the platform
In order to trade simply select the "Options" list from the list of available baskets in PowerDesk. When launched, you will see the Options center displayed - the popup completely dedicated to Options transactions. The window can be enlarged to full screen or shrunk, by selecting the icons in the top right of the screen.
All the current available expiry dates which are traded on the IDEM market are displayed in the pop-up heading by default.
The drop-down menu is selected by default for the FTSE MIB index options; by scrolling through the menu you can select the options on various IDEM shares and the options on the DAX and EUROSTOXX50 indices.
Options centre

By clicking on "Advanced Search", you can carry out a more precise request by simultaneously cross-referencing several variables. The Strike price of each contract is positioned at the center of each row against a yellow background. For each level, you will see all the Put contracts to the right of the strike price and all the Call contracts to the left of the strike price.
For improved trading, by clicking on the "CALL" ("PUT") button, the call (put) panel options only expands to full screen; by clicking the button again, it returns by default to the initial view.
Trading: you will see the PowerBoard with the book, order screen, tick-by-tick chart, order entry and time and sales displayed by double-clicking on each contract row (to the right for puts, or to the left for calls).
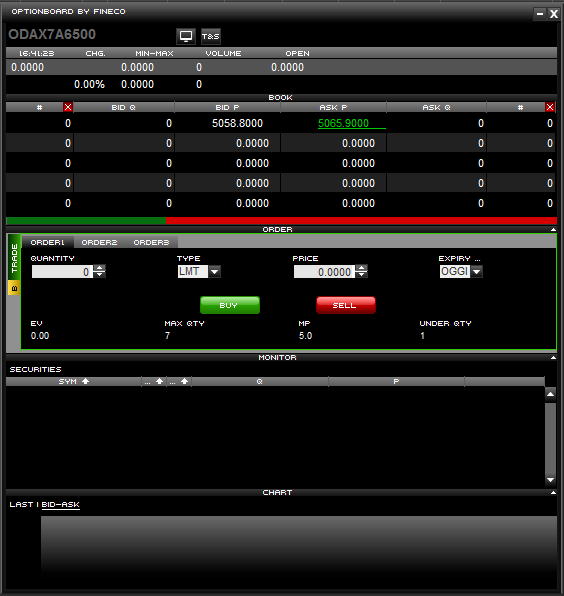
> Order screen. Each transaction is displayed in the order monitor, in the general "securities" section. The fields displayed are:
- "SYM": Option symbol.
- "ST": Order status. The information provided by the market concerning the execution status of the order at that point in time. This status can be:
- Executed
- Partially Executed
- Entered
- Cancelled
- Refused
- In the queue
- To be queued - "ENT.Q": Quantity entered in the order.
- "ENT.P": Price entered in the order.
- "EXE.Q": Executed quantity of the order.
- "EXE.P": Executed price of the order.
- "DATE"
Once purchased, each contract is displayed in the general securities portfolio. The equivalent carrying and market value takes into account the contract purchase price x the number of contracts x the multiplier (2.5). For each contract in the portfolio, the same columns already indicated for standard trading on equity securities are evidenced
> P&L panel
The profit and/or loss for each closed position is indicated in the "P&L" panel.
As occurs for any PowerDesk list, you can also customise the Options centre (from the preferences panel) with the skin colour, the font size and the highlighted columns
Trading on Bonds
With PowerDesk you can trade all TLX, EuroTLX, MOT and EuroMOT market bonds with prices updated with push notifications, a 5-level book, PowerBoard and Time & Sales. By selecting "MOT" from the drop-down menu of the baskets available on PowerDesk you access the list of bonds most traded by FinecoBank customers. By selecting "TLX” you access the list of the 50 most traded bonds on the market.

From the platform search function, you can search for any other bond traded on MOT and TLX and enter it in customised watchlists.
All the instruments and operating functions for equity securities can also be used for bonds: 5-level book, push notifications, PowerBook, charts, Time & Sales.
PowerDesk only displays the clean price without any details concerning the coupon, its maturity and detail sheet. There is more comprehensive information concerning each security on the Fineco website.
All positions opened on bonds are held in the general securities portfolio; the P&L window allows you to see the updated information concerning all gains and losses recorded both for intraday and multiday positions.
On PowerDesk you cannot trade securities traded on the Fineco Systematic Internalisation (SI) system. Fineco SI market system bonds can only be bought and sold on the website. If you have bought a Fineco SI market security from the website, you can also view it in the PowerDesk portfolio, but you can only sell it through the website.
Trading on the platform
You can trade directly from the default "TLX" and "MOT" lists or by entering a security in your customised lists.
You can use all the modules and functions already described for standard trading on equity securities: expanded row, PowerBoard, conditional orders. Every order is displayed in the "securities" order screen.
Open positions are instead updated in the "securities" portfolio: the theoretical P&L is calculated based on the difference between the market value and the carrying value; any possible coupons are not calculated in the PowerDesk portfolio, but they can be viewed in the Fineco website portfolio.
Trading CFDs
You can buy and sell Contracts for Difference directly from the PowerDesk platform. By clicking on the link in the PowerDesk drop-down menu you can access the list of available CFDs. The following is displayed for each CFD:
- SYM: symbol that identifies each CFD.
- DESCR: extended description of each CFD (for example FTSE MIB).
- BID P.: bid price. By applying this price, you sell the CFD. A
- SK P.: ask price. By applying this price, you buy the CFD.
- MIN: the lowest bid price quoted by the Bank during the day.
- MAX: the highest bid price quoted by the Bank during the day.
- CHG: percentage change in the current bid price over the closing price of the previous day.
- TIME: time of the last change.

To trade, you need to ask that the service be activated in the "Service Management" page on the Fineco home page.
Trading methods
You can enter orders directly from the CFD basket or by entering the instruments you are interested in into one of your customised watchlists; in this case you need to indicate the CFD symbol in the "sym" box and add it to the list like any other financial instrument or drag it, left-clicking the desired list.
There are two different methods available:
- Expanding the row in the watchlist or in PowerBoard
- By expanding the row of the single CFD in the watchlist, both the bid and ask prices are displayed

- By right-clicking on the CFD, you can access PowerBoard: at the top you can see the bid and ask prices and just below is the order entry screen.
You can change the CFD displayed from the two drop-down menus at the top or simply with the drag & drop option.
The Bid/Ask screen and chart are also available on PowerBoard.

Order entry
Three types of orders are available: LIMIT and Conditional orders, with which you send Fineco an order to buy or sell a CFD if the market reaches a certain level and MARKET orders, which can be used to apply the quote available at the current price.
ORDER ENTRY
The same order entry screen is available in the expanded row and in PowerBoard. To buy you must apply the ask price; to sell you must apply the bid price.
You must indicate the following for every order:
- Number of lots: for each instrument the lot corresponds to an underlying equivalent value.
- Type: the type of order submitted. It can be "Market", "Limit " or "Conditional".
- Price: LMT (limit price); MKT (market).
- Validity: Day, your order is valid until closure of the underlying instrument; GTC, "good till cancelled".
- Intraday Trad: (operations that must be closed at the end of the day); Multiday (valid for several days).
- Margin: by choosing Intraday trading, the margin levels you can select are: from 1% to 100% S
Should you choose Multiday trading, the margin can be selected from a predefined list from 7% to 100%.
Order Screen
By clicking on the "CFD" link in the PowerDesk screen you can see all the orders entered on CFDs.

> Summary row:
The first row summarises the overall balance of the position and indicates:
- SYM: the position cross symbol.
- ST: status of the position; OPEN (open position); CLOSED (closed position).
- L/S: position sign; Ov (Multiday or Overnight cross position); In (Intraday cross position).
- ENT.Q: quantity of lots entered on the position
- ENT.P: price entered
- EXE.Q: quantity of lots executed on the position
- EXE.P: average carrying value of the position
- STOP: indicates the price level at which the position will automatically be closed
- DATE: the date of first opening of the position
- Margin: margin percentage with which the position was opened
> The columns relating to single orders indicate instead:
- SYM: the time the order is executed.
- ST: order status; EN (order entered); CA (order cancelled); EX (order executed).
- L/S: order sign; L (long buy order); S (short sell order).
- ENT.Q: quantity of lots entered, referring to the order
- ENT. P: the price entered on the market
- EXE.Q: quantity of lots executed on the individual order
- EXE.P: the price at which the individual order was executed
- DATE: the date on which the order is executed
 repeat order button
 button to cancel entered orders
Portfolio
All the open positions on this market are grouped in the portfolio area dedicated to CFDs. The individual columns indicate:

- SYM: the symbol of the CFD related to the open position.
- QTY: quantity of lots in the portfolio and sign (+ or – according to whether the position is long or short)
- THEORETICAL P&L: the theoretical profit and loss deriving from your transactions. It is always expressed in the currency of the underlying CFD.
- P&L Euro: this is the real-time conversion of the provisional P&L in Euros. The definitive P&L in Euros will be determined based on the closing exchange rate.
- CLOSE: this button automatically closes your position with a market order.
- Average price: the average carrying value of the position.
- Market price: value of the CFD updated in real time (bid price quote for long positions and ask price quote for short positions).
- %VAR: percentage change of the PL
- CARRYING VAL: equivalent carrying value in the currency of the underlying
- MARKET VAL: equivalent value at the market price
- TYPE: indicates whether the position is open in intraday or overnight margin trading and the related %
- CUR: indicates the reference currency of the CFD
Profit & Loss realised
With PowerDesk, you can view all profits and losses made during the day through transactions on CFDs.
You can access the details of CFD transactions in the P&L panel.
The first row summarises the profit and loss relating to all the closings made in the day on a single CFD. By expanding the row the single closings with the related P&L are shown.
The following is displayed for each closing:
- SECURITY: exchange rate at which the position was closed
- POSITION: the position type (Long/Short)
- TIME: the time at which the position is closed
- TOT P&L: profit and loss per individual position (updated in Euros)
- P&L PERC: profit and loss shown as a percentage
- QTY: overall amount of the position
- AVERAGE CARRYING VALUE: average carrying value of the position (opening value)
- AVERAGE CLOSING PRICE: price of the position on closing (closing value)
- CARRYING VAL: equivalent value of the position on opening
- CLOSING VAL: equivalent value of the position on closing
- CURRENCY: the currency with which the closing is updated
Intraday Positions
Intraday trading implies that the position lasts only the one day: i.e. the position must be closed on the same day of opening. If some positions are still open at the close of the Intraday trading session, Fineco automatically closes all these positions without charging any penalties.
For Intraday trading, select "MI" in the "Trading" drop-down menu in the order entry screen.
You cannot open an Intraday position and a Multiday position at the same time on the same CFD.
Multiday positions
All positions still open at the time of closing the day are multiday positions and bear interest.
The interest will be debited or credited according to whether the position is long or short, subject to applying a spread in favour of the bank.
Trading on CFDs Logos Time
With PowerDesk you can trade CFDs Logos Time with a shares, a currency pair, future (index, commodities or bonds) as Underlying Assets.
You can place orders through the Order Entry mask or via Powerboard. Before placing an order you have to select the margin, the sign (Up/Down) and the duration.
Open positions will be shown in the monitor.
The countdown represents the time left until the position expires.
The chart of the position shows whether the position is in Loss or Gain.
The dotted line represents the opening price of the position. The P&L of the position is shown on the side.
You can also see all the open positions in the Portfolio Details where the theoretical Gain or Loss of the position is shown.
Spot FX trading
You can buy and sell over 50 Forex market exchange rates directly from the PowerDesk platform. By clicking on the “Forex” link in the PowerDesk drop-down menu you can access the list of available currencies. The following is displayed for each exchange rate:
- SYM: the symbol which identifies each exchange rate.
- DESCR: the extended description of each exchange rate (for example Euro/Dollar).
- BID P.: bid price. By applying this price, you sell the currency pair (you are selling the base currency and buying the quote currency).
- ASK P.: ask price. By applying this price you buy the currency pair (you are buying the base currency and selling the quote currency).
- MIN: the lowest bid price quoted by the Bank from 23:00 on the previous day.
- MAX: the highest ask price quoted by the Bank from 23.00 on the previous day.
- CHG: percentage change in the current bid price over the closing price of the previous day.
- TIME: time of the last change.

To trade, you need to ask that the service be activated in the “Request new services” page on the Fineco home page.
You can trade on all currency pairs, selecting the base currency from the drop down menu located at the top centre of the “Forex” watchlist.
Trading methods
You can trade directly from the "Forex” basket or by entering the exchange rates into one of your Watchlists; in this case you need to indicate the symbol of the currency pair in the "sym" box and add it to the list like any other financial instrument.
There are three different methods available: Expansion of the row, Powerboard, and the new MultiBook.

- By expanding the row of a single currency pair both the bid and ask prices are displayed: the two most significant decimals (also called pips) are highlighted with a larger font.
The book can be displayed on the right or left of the order entry, as can the order screen and the Bid/Ask chart.
- A dedicated PowerBoard is available for the Forex market: at the top you can see the bid and ask prices with the order entry screen immediately below.
You can change the exchange rate displayed directly from the two drop-down menus at the top or simply with the drag & drop option.
The Bid/Ask screen and chart are also available on PowerBoard.
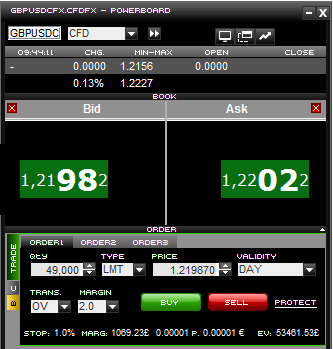
- The new MultiBook is the interface specifically dedicated to Spot FX Trading: you can view the quotes of all currency pairs in the Forex Watchlist.
› Click on "multibook" to open a dedicated pop-up: you can add other currency pairs by clicking on "add book". Each exchange rate can be moved or deleted by clicking on "align all". By clicking on "delete all", you delete all currency pairs in the window;
› Trading is quick and simple: click twice on the price to open the order entry where you can enter your market orders.

Order entry
There are three different types of orders for trading on the Forex market: LIMIT and STOP orders, with which you can send FinecoBank an order to buy or sell a currency amount if the market reaches a certain level and MARKET orders, which are used to apply the price available at the current exchange rate.
ORDER ENTRY
The same order entry screen is available in the expanded row, in PowerBoard and in Multibook.
If you are willing to buy you must apply the ask price; to sell you must apply the bid price.
You must indicate the following for every order:
- Amount: the list of predefined amounts relating to the base currency.
- Type: the type of order entered. This can be a "Market", "Limit" or "Stop" order.
- Price: LMT (limit price); MKT (market)
- Validity: Day, your order is valid until 10:00 PM (until 9:50 PM for Intraday orders); GTC, "good till cancelled".
- Intraday Trad: (operations that must be closed at the end of the day); Multiday (valid for several days).
- Margin: by choosing Intraday trading, the margin levels you can select are: 1% and 1.5%
Should you choose Multiday trading, the margin can be selected from a predefined list from 2% to 30%.
> MARKET order
You can use this order to buy or sell at current market prices.
The order allows you to trade immediately, buying at the ask price and selling at the bid price.
You therefore accept the price quoted by the market at the time it receives your order.
> LIMIT order
You can use this order to
- buy at or below the market price
- sell at or above the market price
It is generally used to make a profit on an already open position and in this case it can also be defined as a "Take Profit" order. Alternatively it can be used to open a new position.
You can submit LIMIT orders to buy at a price below market prices and to sell at a price above the current price.
However, these orders will be executed:
- If you are buying, when the market ask price reaches that level.
- If you are selling, when the market bid price reaches that level. In these cases they will only be executed at the indicated price, neither worse nor better.
> STOP order
A Stop order is entered when you want to:
- buy at a price above the market price
- sell at a price below the market price
A Stop order is generally entered in order to limit a potential loss in relation to an open position and in this case it can also be referred to as a "Stop Loss" order. For this reason, when the price condition you have indicated is met, the STOP order is entered as a MARKET order so as to guarantee its execution in any case, even though the executed price may be slightly different than the indicated condition. A STOP order can also be used to open new positions when reaching a certain technical level that is deemed significant. In this case it is defined a "Stop Entry" order.
> Operating notes:
- A Buy STOP order can be only be executed when the ask price reaches the indicated level. It is possible that the order could be executed at a price that is slightly higher by a few pips owing to exceptional market conditions.
- A Sell STOP order can be only be executed when the bid price reaches the indicated level. It is possible that the order could be executed at a price that is slightly lower by a few pips.
The STOP order windows on PowerDesk are set up to be as intuitive as possible: if you select "buy", the "ask price" field is predefined by default, if instead you select "sell", the "bid price" field is predefined by default.
Order Screen
By clicking on the "forex" link in the PowerDesk screen, you can display all the orders that have been placed on currencies.

> Summary row:
The first row summarises the overall balance of the position and indicates:
- SYM: the position cross symbol.
- ST: state of the position; OP (open position); CL (closed position).
- L/S: position sign; Ov (Multiday or Overnight cross position); In (Intraday cross position).
- EXE.A: the total value of the position.
- EXE.P: the average book value of the position.
- DATE: the date of first opening of the position.
> The columns relating to single orders indicate instead:
- SYM: the time the order is executed.
- ST: the order status; ENT (order entered); CAN (order cancelled); EXEC (order executed); EO (for Multiday positions: automatically reopened in the evening); EC (for Multiday positions: automatically closed in the evening); RO (for Multiday positions: automatic opening in the evening rejected); RC (for Multiday positions: automatic closing in the evening rejected).
- L/S: order type; L (Long buy order); S (Short sell order).
- ENT.A: the amount of the order (as an absolute value) referred to the base currency.
- ENT. P: the price entered on the market
- EXE.A: the executed amount
- EXE.P: the price at which the individual order was executed
- COND: any stop order price set by the customer
- DATE: the date on which the order is executed
 button to cancel orders
Portfolio
You can view all open positions on the currency market in the Forex area of the portfolio. The individual columns indicate:

- SYM: the cross symbol related to the open position.
- QTY: the quantity in the portfolio
- EXP: In (Intraday position expiring at the end of the day) Ov (Multiday position).
- Sign: Long indicates a bullish position on the currency pair, Short indicates a bearish position.
- Amount: overall amount of the position.
- THEORETICAL P&L: the theoretical profit and loss deriving from your transactions. It is always expressed in the quote currency (the denominator).
- P&L Euro: this is the real-time conversion of the provisional p&l (cross quote currency) in Euros. The definitive P&L in Euros will be determined based on the closing exchange rate)
- CLOSE: this button automatically closes your position with a market order.
- Average price: the average carrying value of the position.
- Mkt Price: the value of the currency pair updated in real time (bid price quote for long positions and ask price quote for short positions).
- CARRYING VAL: equivalent carrying value in the quote currency.
- MARKET VAL: equivalent value in the quote currency at the market price.
- CHG: P&L as a percentage, calculated as the difference between the market value and the carrying value
Profit & Loss realised
With PowerDesk, you can view all profits and losses made by trading on the Forex market.
By clicking on the "FOREX" link in the dedicated panel you can only access the transactions concluded through the Trading Spot FX service.
The first row summarises the gains and losses concerning all the positions closed during the day on a single currency pair. By expanding the row the single closings with the related P&L are shown.
The following is displayed for each closing:
- SECURITY: exchange rate at which the position was closed
- POSITION: the position type (Long/Short)
- TIME: the time at which the position is closed
- TOT P&L: profit and loss per individual position (updated in Euros)
- P&L PERC: profit and loss shown as a percentage
- QTY: overall amount of the position
- AVERAGE CARRYING VALUE: average carrying value of the position (opening value)
- AVERAGE CLOSING PRICE: price of the position on closing (closing value)
- CARRYING VAL: equivalent value of the position on opening
- CLOSING VAL: equivalent value of the position on closing
- CURRENCY: the currency with which the closing is updated
Intraday Positions
Intraday trading implies that the position lasts only the one day: i.e. the position must be closed on the same day of opening. If some Intraday positions are still open at the close of the trading session (9:50 PM), Fineco automatically closes all these positions by 10:00 PM without charging any penalties.
Intraday orders can be placed from Monday to Friday from 5:15 AM to 9:50 PM (orders placed via the call centre can be sent from 7:00 AM). For Intraday trading, select "MI" in the "Trading" drop-down menu in the order entry screen.
You cannot open an Intraday position and a Multiday position at the same time on the same currency pair. The margin for Intraday transactions varies from 1% to 1.5%; the Stop Loss value is equal to half a per cent less than the margin level, i.e.: 0.5% or 1% respectively.
Entering Stop Loss, Take Profit and Trailing Stop conditions
It is possible to place automatic orders (Stop loss, Take profit and Trailing) from 5:30 AM until 9:50 PM exclusively on currencies for which intraday trading may be carried out.
Should there be, for any reason, any intraday position still open after 9:50 PM, Fineco will automatically close this by 10:00 PM. Furthermore, all orders still placed on Intraday positions at 9:50 PM, will be cancelled.
> Entering Stop Loss, Take Profit and Trailing Stop conditions on individual orders SL, TP and Trailing conditions can be entered during the order entry stage by clicking on the specific link. In this case the order entry screen expands offering the option of entering an SL or TP order.
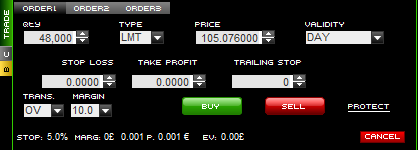
After entering an order with Stop Loss or Take Profit conditions, the button  shrinks, showing the predetermined price for the corresponding Stop Loss or Take Profit.
To edit the values entered, simply click on the arrows of the related box and click on confirm; to cancel the values entered just click on the “x” button.
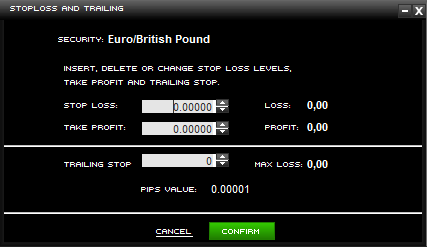
> Stop Loss and Take Profit conditions on the position
Stop loss and Take Profit conditions can be entered on the intraday position, but no Trailing stop can be entered.
The specific button will be displayed next to the string of the open position in the Order Screen  , which will show the default price levels after an SL or TP has been entered.
> Protect  : this button allows you to enter/edit Stop Losses, Take Profits and Trailing Stops on the order.
If a Stop Loss or Take Profit is entered, the size of the button is reduced, showing the predetermined price for the corresponding Stop Loss or Take Profit
Example of an unprotected order: 
Example of an order with a Stop Loss:  (the Stop Loss is always shown on the left)
Example of an order with a Take Profit:  (the Take Profit is always shown on the right)
Example of an order with a Trailing Stop:  (the protect button on the left is a lighter colour)
Enter
As no Last is available on the foreign exchange market, but always a bid/ask price, we must consider that any set stop loss, take profit or trailing stop held on the Fineco servers, will be activated and sent to the market when the bid/ask condition occurs, according to whether the position is short or long.
- Any stop loss, take profit and trailing stop on long positions will be verified against the currency’s bid quote. Conversely, any stop loss, take profit and trailing stop on short positions will be verified against the currency’s ask quote.
Important notes:
> The joint use of Stop Loss and / or Take profit on the order and on the position may not result in the immediate closing of the position, thereby producing its rollover.
> The orders entered (including conditional orders) which are not yet executed always keep the position open.
> Before Fineco sends the automatic Stop Loss, any orders entered on the position which is about to close will be cancelled.
> Trade & Reverse cancels any Stop loss and Take profit placed on the position, but does not modify the settings placed on the single orders which remain active.
Multiday positions
All positions open at the time of closing the service (10:00 PM) are automatically closed and reopened by Fineco. This mechanism allows keeping positions open for several days, avoiding the physical delivery of the currency.
At 10:00 PM, Fineco closes the position and opens a new one with the same margin, amount and price.
The reopening price is the same used to close the position and is not increased by any bid-ask spread.
Reopening updates the carrying value which takes into account the difference between the rates of the two currencies on which a position is open: the rate on the bought currency is receivable, while that of the sold currency is payable.
Any Pips are deducted from or credited to the new carrying value.
PowerChart
PowerChart is one of the most advanced systems for studying markets and financial instruments thanks to its integrated technical analysis indicators, and the usability of all its available tools.
In order to view the PowerDesk charts, you can use the button at the end of each single row, which may be configured from the preferences panel, or via the right mouse button by placing the cursor on the row of each security.
The main features are controlled via the icons arranged around the chart area and are then displayed in the main panel or in the two side panels.
The main panel displays the chart of the security, while the subpanels show the volumes, technical indicators (when not superimposed on the chart) or the zoom.
The most recently introduced changes allow you to have:
- MultiCharts to display up to 6 charts in a single pop-up. You can move and change the size of the window as you please in the monitor and follow the graphs of your securities in real time.
- Chart trading allows you to add, change or delete orders, stop loss and take profit conditions directly by simply clicking on the chart.
- Historical series up to 30 years and a Tick by Tick chart.
- The possibility of selecting different time frames for each frequency.
- Charts also for MOT and TLX market bonds.
- More than 90 Technical analysis indicators, grouped into uniform and totally customisable categories.
- The possibility of overlapping the chart with any number of indicators.
- Export of historical series directly onto your PC.
- Chart navigator, zoom "click and drag".
- Maximum freedom of customisation: background colours, grids, labels
You can also:
- Use the Point Figures chart
- Compare the performance of 2 or more stocks / indices with each other by using the Compare function
- Save your chart studies and create your own templates or default workspace
- Use the Fibonacci and Gann fan indicators
- Display the percentage and absolute deviation on each trendline
- Move and expand the chart in all directions
For further details, you may download the User Manual in Pdf format or consult the on-line version.
Chart Trading
Chart trading is the advanced system which allows you to enter, modify and cancel orders of all financial instruments, with a simple click directly on the chart.
An icon has been added to the charts in the top left corner  , off by default, which allows you to view all orders placed and executed during the day and to place orders directly from the chart.
By placing the cursor on the chart, at any price and by clicking the right mouse button once, the order entry pop up will appear.
You can cancel orders and then re-enter them at a different price level simply by dragging the label displayed on the chart.
You can view, edit and delete a stop loss, take profit or trailing stop set on the single orders, directly on the chart. By entering orders associated with any stop loss, take profit and trailing stop, all the labels displaying Sl / Tp / trailing values will appear on the chart near the order label (on the far right).
The labels indicate:
- The type of set strategy: Stop - Take or Trailing
- The set price
- The "x" that automatically erases the single strategy
By clicking the right mouse button, the "stop loss and trailing" pop-up will appear in the single label which allows you to enter/edit/delete strategies.
Therefore, the strategy may be:
- entered from the order entry or the monitor
- modified by using the icons that open the "stop loss and trailing" pop-up in the order screen or by recovering the same pop-up from the label
- deleted from both the pop up and the "x" positioned on the label
It is also possible to use the Bid/Ask indicator to view the composition of the amounts in the first 5 levels of the book directly from the intraday chart.
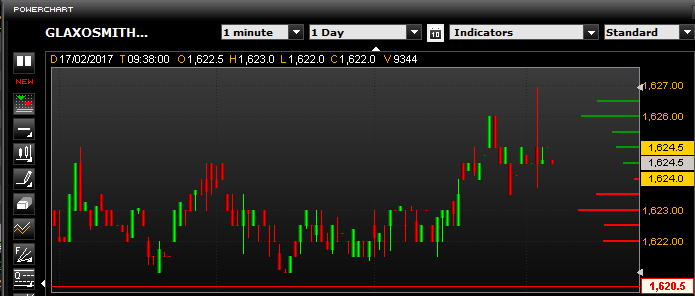
For further details, you may download the User Manual in Pdf format or consult the on-line version.
Note:
- Cancelled, rejected, queued or to be queued orders will not be displayed on the chart.
- For transactions on Forex and derivatives, the labels of the orders entered, executed and partially executed do not have the C key; you can close the transactions only by entering an order in the opposite direction or by using the "C" key in the Securities Portfolio.

Tips & Tricks
This page collects all the suggestions to make the best use of the PowerChart and to fully exploit its potential:
- How to make the best use of the Zoom
By pressing the "magnifying glass" button, you can activate (the icon changes colour) or deactivate the Zoom.
By keeping the left mouse button pressed on the chart, you can select the desired area. When you release the mouse button, you will begin to zoom. To restore the initial chart, double click on the right mouse button or double click on the "magnifying glass". - How to update the chart data
The "Reload Data" button allows you to update the data and to redraw the graph.
Important: by carrying out this operation you will lose all the studies set on the chart up to that point. - Maximise the chart area
By double-clicking the left mouse button, you can expand the chart to the maximum window size. To restore the initial size, repeat the operation. It is also possible to further enlarge the chart, hiding the side icons by clicking on the small green triangles on the sides and top edge of the chart itself. - How to move along the selected historical series
Use the Chart Navigator to move along the historical series of the chart. You can reduce or increase the period of interest by moving the sidebars. You can also move along the chart by keeping the left mouse button pressed. - Saving your charts and studies
You can save your studies on the chart using the Load / Save key. You can create up to 5 pre-defined templates for all your charts, or you can save your analysis by using up to 10 Workspaces.
You can also save the charts on your PC or print them directly by clicking on the Snapshot key. - Chart comparison
With the "Compare" function you can compare the charts. After opening the chart of the first security, place the mouse on the symbol of the security which you wish to compare and drag it while holding it with the left mouse button. The two charts will appear superimposed. This way, you can compare up to 5 securities or indices. If you want to delete a chart, click with the right mouse button on the name of the security corresponding to the chart. If you want to exit the "Compare" mode and return to the first open chart, click the Powerchart icon at the bottom left. - To move the chart
While keeping the left mouse button pressed, the pointer icon becomes a "hand" which allows you to move the chart in all directions. - View and edit the chart’s properties
A click on the right mouse button opens the configuration panel of the chart’s properties. Should you have applied studies and/or indicators to the chart, the panel will be divided into Tabs in order to customise each study or indicator. - Possibility of customising the features of the chart
The "Chart Properties" icon allows you to open a panel where you can customise all its properties in order to obtain the closest graph to your operational needs. - How to read a trendline easily
You can display the percentage and absolute value deviation on each trendline that you draw on the chart.
You can personalise the colour, thickness and line style using the panel by clicking with the right mouse button. - How to view the many functions of some keys
Some icons have a small black triangle in the lower right corner. This indicates that there are more instruments of the same functional class, accessible through a pop-up menu. Select any icon showing a triangle, click it and hold the mouse button, you'll see the other available instruments. - Viewing and extracting historical series
The "Historical Series" icon, allows you to view the historical series data of the selected security in a window for the time frame displayed. By pressing the "Export" key, you can export the table data in Excel format. You will be able to use the data thus converted on any program for processing spreadsheets. The "Print" key, allows you to print the data directly. - Using the TickbyTick chart
The TickbyTick chart is an excellent support for traders who require a real-time display of all individual exchanges traded on the market.
Multichart
The Multichart mode allows you to choose between a range of chart configurations in order to "keep an eye" on other security charts with greater ease and speed, all in a single pop-up.
When opening a chart, you will see the "Multichart" icon which, when clicked, will change the pop-up display.
The new pop-up displayed will be divided into two parts: on the left, you will see the chart of the previously selected security as well as the volumes and the right section which will be initially empty.
In the right section, by entering in the search windows the name or security symbol and selecting the market, you will see the security’s chart. Securities can be entered into the empty sections even with the drag & drop from the security’s Watchlist string or from the predefined lists.

You can choose three different contextual configurations: a 2-chart, a 4-chart and a 6-chart layout.
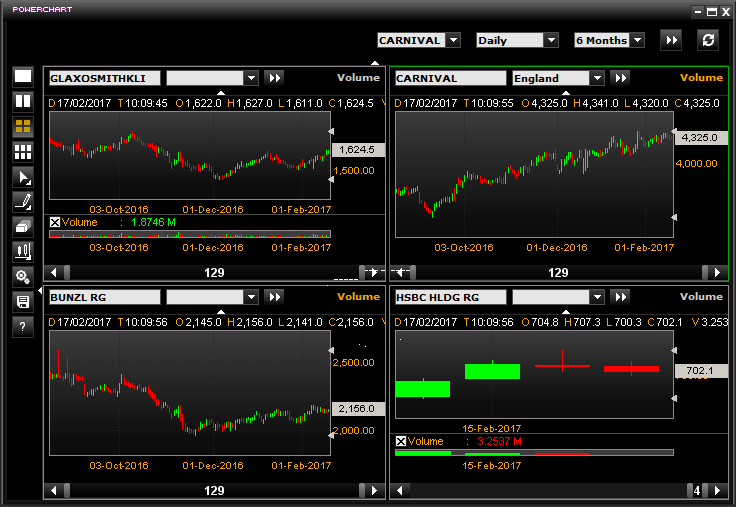
It is possible to expand the chart to full screen, or narrow it down and change the pop-up for a horizontal or vertical display, simply by dragging the right box frame of the pop-up.
By dragging the box frame, the charts will shrink and they can be aligned horizontally or vertically as you wish:

The pop-up which opens at the top has a common bar with the pull-down menu in order to select the chart’s time frames and the depth which will be applied equally to all charts.
In the left hand frame, you will see:
- three icons to open the different configurations:
 two charts
  four charts
 six charts
  change the chart layout (candlestick or linear)
- the "Back to Chart icon
 to return to Powerchart. It allows you to return to the chart of the starting security or the selected chart.
NB: If you open a multichart, the starting X security chart is highlighted with a green frame. Should you click on another chart (Y security), the latter will be highlighted, and if you click the icon the Y security chart will then be displayed.
 refers to the Powerchart manual
 opens the Multichart save pop-up
 to enter trendlines
 allows you to edit the multichart configuration: when off (by default) it allows an automatic configuration of the charts. Therefore, all the charts will open with an equal size, and if you drag their box frame they will all expand and shrink. When clicked (it stays lit) it lets you enlarge and shrink all the charts by simply dragging their frame.
In addition, you can clear each chart of all Volumes; to restore them, there is the link which will light up whenever the volumes are removed from the chart.
PowerCell
This is the DDE platform that allows you to use automatic update formulas and download data in real time, available from PowerDesk.
Activation
The monthly fee for PowerDesk includes the PowerCell platform. The use of PowerCell, is consequent on the PowerDesk subscription.
The trading platform is not necessary for an ordinary use of PowerCell, as explained in the section on using Fineco’s DDE.
Installation and use
To install Powercell and activate the connection, simply open PowerDesk and click on the PowerCell button on the watchlist management bar.
The engine is automatically installed on your hard disk in the Windows directory. After installation, the FDF icon will be displayed in Desktop.

After clicking on the Powercell button a pop-up is displayed with the message "You have validated your connection to the Powercell platform".
The FDF engine status is always displayed in the Windows taskbar: when red, it is not connected to Fineco servers; when yellow, it is active but not authenticated; when green it is active and authenticated. If you are unable to authenticate your connection, check the settings of your browser or use a different browser.
NOTE: you don’t need to open PowerDesk to use PowerCell, because PowerCell is an independent platform.
PowerDesk
From PowerDesk you can directly download the formulas in 4 different ways:
- In the watchlists, click on the button on the left of the advanced search lens, open an Excel spreadsheet, then click on paste. All values and automatic update formulas will be automatically copied to Excel.
- Click with the right mouse button on the single instrument you want to copy, open the Powercell item to decide whether to copy the entire watchlist, the single instrument, the linked book or a selection of instruments.
- In search securities, after searching for the security, click on the PowerCell button and paste to Excel. The formulas of the securities master record will be made available in Excel.
- In select Covered Warrants click on the PowerCell button to copy and paste to Excel each value in the specific Covered Warrants window.
After clicking on the PowerCell button in PowerDesk, you have to open an Excel spreadsheet and paste the formulas.
Note: You can subscribe to push notifications for up to 199 securities.
Starting from the sample file or spreadsheets created starting from PowerDesk, each formula can be copied and pasted to other Excel files.
Alternative installation and use without accessing PowerDesk:
In Markets and Trading - Platforms and services - PowerDesk, there is a specific Powercell paragraph with the Installer program that you can use to install the FDF engine.
How to use PowerCell
To launch PowerCell, after installing the FDF engine:
- Click on "Launch" from the Platforms link at the top of the pages on the website.
- Launch the FDF engine (double click on the icon).
- The FDF engine status is always displayed in the Windows taskbar: when red, it is not connected to Fineco servers; when yellow, it is active but not authenticated; when green it is active and authenticated. If you are unable to authenticate your connection, check the settings of your browser or use a different browser.
- Open the automatic update files. When these spreadsheets are opened, you need to confirm macro activation before receiving quotes in real time.
Formulas
This spreadsheet lists all formulas available in PowerCell DDE.
Each available value has a formula made up of:
=FDF|Q!'G.MI;open'
where the elements you can change are the instrument symbol (G.MI= symbol+ market extension) and the type of information to display (open).
Each formula is automatically updated, so just one of the two elements (symbol and value) needs to be changed. A number is associated with each data item that can be downloaded.
With PowerCell, each formula can also be coded as follows: = FDF|Q!'G.MI;open' is equivalent to = FDF|Q!'G.MI;13'
Logos Desktop
The Logos Desktop platform allows you to buy and sell European and American shares, world indices, commodities, foreign currencies and bonds. You can trade with reduced margins up to £ 50, guaranteed stop loss, quoted prices in push, zero trading fees and zero activation costs.
When first accessing Logos, you will be offered the option of saving your device PIN, so that it remains active for the entire session of use.
Upon first access the platform shows the Search area containing all the instruments and the Desktop area where you can drag and save your favourites.
The Logos Trading Platform consists of:
INSTRUMENT SEARCH AREA
Upon opening the platform, a panel appears on the left, with all the instruments which you can trade.
You can scroll through the whole list, search for instruments by type (click on the “all” item) or, alternatively, filter by single instrument by typing the name in the search area.
You can drag the single instruments in one or more of the 3 Desktops available, just click on the chip and drag the instrument keeping the button of the mouse pressed. Release the button to drop the chip into the Desktop.
A single click on one of the chips contained in the Search opens the order entry screen at the centre of the platform. Use the “Magnifying glass” icon in the top left of the platform to open/close the search panel.
DESKTOP
The desktop is the area where you can customise the positioning of the chips. Once dragged from the search engine, the chips can be organised and saved in each of the 3 available desktops.
To add a work space, just click on the “+” button, in the bottom left of the platform.
With a double click on the word "Desktop", you can customise the name of the work space.
The Desktop contains:
- The Chips exported from the Search, bearing the logo of the instrument, the bid/ask quoted prices, the daily change of the instrument and a min/max bar, indicating the instrument's actual price level compared to the daily minimum and maximum.
- The order entry screen, opened by clicking on a Chip of the Search or of the Desktop. The order entry screen reports the daily change of the instrument, its name, the position opening buttons (Sell to open short positions; Buy to open long positions, Up arrow for bullish Binary Options and Down arrow for bearish positions), the daily graph of the instrument and the daily quoted price data, which can be reached in turn by clicking on the arrows placed at the bottom of the order entry screen.
- Open positions: after opening a position, under the chip one or more squares appear (depending on the number of open positions) representing the existing position/s. The square will have a green background in case of gain, a red one in case of loss. The arrow in the open position indicates that the position is bullish when facing upwards, bearish when facing downwards.
N.B: To save the chips in the Desktops you need to Logout using the closing button at the right hand bottom of the Platform. If you close the platform by closing the Browser, no action will be saved.
For CFD Logos Time the position cannot be closed before the time established at the time of opening that position.
OTHER FUNCTIONS IN THE PLATFORM
BALANCE: liquid funds available for transactions
PROFIT&LOSS (P&L): sum of the profit/loss of the open positions
MONITOR PANEL: summary of the orders with time, date and reference currency.
PROFIT&LOSS PANEL: page to query the positions with summary of data per position. The P&L of the day, the week and the last month can be queried.
SETTINGS: panel to manage the favourites and select the default margin, the account of operation in case of more than one account, the activation of alerts and the background colour.
MESSAGES: area containing all the Logos messages,
LOGOUT: closing of the Platform with the possibility of saving the arrangement of the Logos.
CFD Logos Time
Platforms
You can trade CFD Logos Time via:
- the private area of the website and the FinecoBank app
- the Logos mobile app, available for IOS and Android
- the Logos Desktop platform, which can be enabled from the Platforms link in the Client Area
- the Powerdesk platform, which can be enabled from the Platforms link the Client Area
Description
The Logos Time trading service allows you to open CFD positions for the purpose of profiting from even the slightest changes in the price of the same CFD, within a previously selected period of time. The price of each CFD Time is closely linked to the price of the underlying financial instrument share, a currency pair or future, since the price of the CFD Time is the arithmetic average of the Bid/Ask price of the first Book level of the underlying instrument.
Example:
The current price of the CFD Time “X” equals £ 10.00 and you decide to trade “Up” (the price of the instrument upon maturity will be higher than the price at the time of opening). Duration 5 minutes.
Opening a Time position with the “Up” sign, if after 5 minutes the price of the CFD “X” is > £ 10:
- The margin paid is returned and a P&L credited, which is equal to the same margin multiplied by a payout.
- Vice versa, if the price of the CFD “X” is <= £ 10, a loss is realised equal to the margin paid.
NB: the fact that the condition occurs (Price > 10) during the period of validity of the position is irrelevant. The outcome of the position will only be valued depending on the price recorded at maturity.
Selecting the margin and respecting the ceilings
You can open Time positions by selecting the desired margin from a predefined list (£ 25, £ 50, £ 100, £ 250, £ 500). You can open Time positions by selecting the margin desired among a predefined list.
Regardless of the trading currency of the instrument underlying the CFD (Euro, Dollar, etc.), the trade, payment of the margins and the credit/debit of the Profit&Loss will always take place using the Euro.
The simultaneous opening of time positions for a total equivalent value exceeding £ 2000 (maximum exposure) is not permitted; attempts to open new positions that would lead to exceeding that ceiling will be automatically refused.
Each order placed by user will generate a separate position. If for example you place an order on CFD Time on DAX and subsequently place a new one on the same instrument, the 2 orders will create 2 separate positions from each other.
Selecting the timeframe
Having selected the margin, you can select the timeframe of the Time transaction from a basket shown on the Logos platforms (1 minute, 5 minutes, 30 minutes, 1 hour, 1 day).
The timeframe indicates the validity of the Time position selected. If for example, having selected a “1 minute” timeframe, the position is opened at 16:01:31 hours, the automatic closing of the position will take place at 16:02:31 hours.
Note: as the time of closing the trade gets closers, some timeframes will cease to be available. If for example the closing time of the trade is 17:29:00 hours, from 16:54:01 hours it will no longer be possible to enter proposals with a “30 minutes” timeframe.
Selecting the sign
Once both the margin and timeframe have been selected, you can select the sign of the Time position depending on the expectations.
If you believe that the price of the CFD will increase, select the “Up” sign.
If at maturity:
- the price is greater than the price recorded at opening, a P&L will be collected equal to the product of the margin selected and the payout factor
- the price is lower than or equal to the price recorded at opening, a loss will be realised equal to the margin paid;
Whereas if you believe that the price of the security will drop, select “Down”.
If at maturity:
- the price is lower than the price recorded at opening, a P&L will be collected equal to the product of the margin selected and the payout factor;
- the price is greater than or equal to the price recorded at opening, a loss will be realised equal to the margin paid;
Possible operating results
| Position Sign | Opening price > Closing price | Opening price < Closing price | Opening price = Closing price |
| UP (Long) | negative P&L | positive P&L | negative P&L |
| Super BTP | positive P&L | negative P&L | negative P&L |
PRACTICAL EXAMPLES
Example 1:
At 15:29:01 hours, the CFD Time on security "X" has a quote of 1.20. The expectation is that, in exactly 1 hour (16:29:01) the instrument will have a quote higher than 1.20. The current payout factor will be 85%.
Thus by selecting the margin (£ 25) and the timeframe (1 hour) from among those made available by the Bank and setting "UP" for the trade, the CFD Logos Time position is opened with an opening price of 1.20.
From the time of opening to the time of closing, you cannot intervene on the position, but you may view the trend from the Logos Desktop and Mobile platforms, both via the position chip and the data reported in the Portfolio panel.
At closing (16:29:01 hours), the price of the CFD is recorded again. In the example we shall assume this is £ 1.21. Since this is higher than the opening price (£ 1.20) and since “Up” is the sign of the position:
- the margin (£ 25) is returned to the available balance
- £ 21.25 are credited, equal to the margin (£ 25) multiplied by the payout factor (0.85)
The platform will show for a few seconds, upon closing the position, a “Profit £ 21.25” message.
Example 2:
At 18:00:15 hours, the CFD on security "Y” has a quote of £ 100. The expectation is that, in exactly 5 minutes (18:05:15 hours), the CFD will have a price lower than £ 100. The current payout factor will be 75%.
Thus by selecting the margin (£ 100) and the timeframe (5 minutes) from among those made available by the Bank and setting “Down”, the CFD Logos Time position is opened with the opening price of £ 100.00.
After 5 minutes, at 18:05:15 hours, the price of the CFD "Y" is recorded again, which we shall assume is still equal to £ 100.00. Since the price is identical to the opening price and since “Down” is the sign of the position, a loss is realised equal to the margin paid, i.e. equal to - £ 25.
Upon closing the position the platform will show a “Loss £ 25” message for a few seconds.
At 19:58:01 hours, the CFD on security "Z" has a quote of 10,680. The expectation is that, at the end of trading (22:59:00), the CFD will have a price lower than 10680. The current payout factor will be 75%.
Thus by selecting the margin (£ 50) and the timeframe (1 day) from among those made available by the Bank and setting “Down”: the CFD Time position is opened with the opening price of 10680.
Once the closing time is reached, i.e. at 22:59:00 hours, the price of the CFD on the security "Z" is recorded again, which equals 10681. Since the price is higher than the price at opening and since “Down” is the sign of the position, a loss is realised equal to the margin paid, i.e. equal to - £ 50.
Upon closing the position the platform will show a “Loss £ 50” message for a few seconds.
Trading times
For each CFD Time a start trading time and an end trading time are identified.
| Underlying of the CFD Time | Proposal entry start time | Trading closing time |
| UK and Italy shares | 09:00 | 17:29* |
| Nasdaq and NYSE shares | 15:30 | 21:59* |
| Italy Derivatives Indices | 09:00 | 17:49 |
| Europe Derivatives Indices | 08:00 | 21:59 |
| Derivatives on Europe Bonds | 08:00 | 21:59 |
| CME Derivatives on Indices, Commodities, Currencies | 08:00 | 21:59 |
For each timeframe that can be selected, there is a last time available to open new positions: e.g. for the CFD Time with the Nasdaq and NYSE shares underlying, the last time possible to open a position with a 30 minutes timeframe will be 21:29:00, while the last time possible to open a position with a 5 minute timeframe will be 21:54:00.
For UK, Italy and US shares the proposal can be inserted up to 60 minutes from the trading closing time.
Suspended instruments
If the underlying of the CFD is suspended during the entry time of the open CFD Time order, the order will be automatically refused by the system and no position will be opened.
Whereas if the underlying of the CFD is suspended at the time of closing the CFD Time position, the position will be closed at an identical book price to the opening price, thus generating a P&L equal to £ 0.
Upon closing the position the platform will show a “Cancelled” message.
