Trading Tools
With Fineco you can invest in leading world markets with just a few clicks, assisted by the most advanced tools and availability of the latest news in real time, which means you are always kept up-to-date and can analyse the trend of each security in detail.
In this section, you can find information about how to start trading on the stock exchange and namely how to:
- Create your investor profile
- Take advantage of the decision-making support provided by Fineco
- Find out everything there is to know about the performance of securities, budget data and the charts in the security information sheet
- Understand any type of order
- Place an order
- Be protected by the Stock Market filters
Your MiFID profile
Following the introduction of the European MiFID and MiFID II Directives, Fineco is required to assess its customers' transactions based on the investment services and financial instruments offered. To enable the bank to do this, all customers must define their financial profile with information on:
- Knowledge of and experience with investments.
- Investment objectives.
- Financial situation.
The page of the Fineco website in HOME > ACCOUNT MANAGEMENT > Personal profile, where you can answer the questions in the questionnaire, is shown below:
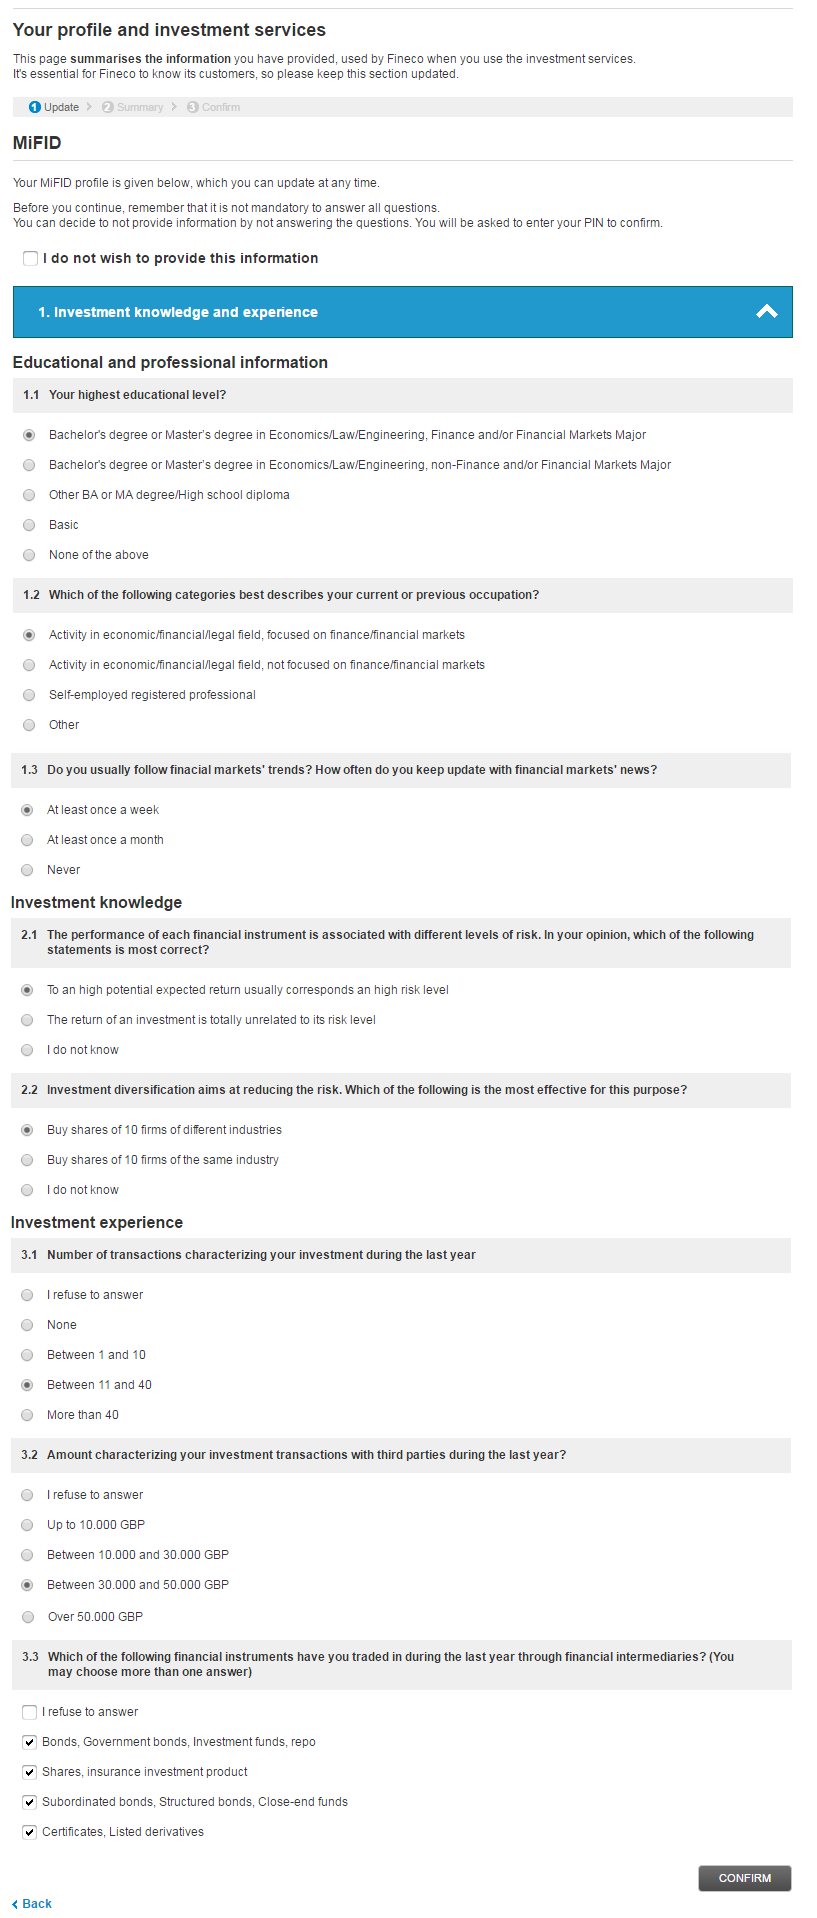
Based on the information you provide, the bank will assess the appropriateness and suitability of your transactions. You may update your financial profile from the website or through your Personal Financial Adviser.
Important! Please remember that while it is not mandatory to provide such information under current regulations, each broker is in any case required to give an opinion on the suitability of their customers' transactions.
If you decide not to provide the requested information, FinecoBank will base its opinion on a standard level that corresponds to the most prudent stance possible for each parameter. Any answers that you may have already provided will be deleted.
Technical analysis
Fineco's services are not limited to the technological platform used to collect and execute orders on the markets. The contents offered to the most demanding and active customers are among the strengths of Fineco's trading services.
Fineco's technical analysis is a simple and practical aid for day-to-day security trading, for experts and less experienced customers. Updated every day, the technical analysis is based on historical data and projections of future trends, processed using tried and tested mathematical models.

On the specific pages for each security available to buy or sell, Fineco provides interactive charts displaying the trend of the security selected along with a technical analysis section.
Operating with these kinds of tools, which were once only available to dealers, means considerable added value.
The analysis of the security allows you to view four important values:
- Analysts' rankings for the security: this provides an indication of sentiment on the security in question, with details for managing the position.
Strong BUY: A strong buy signal (once in position: maintain)
BUY-Accumulate: Consolidation of the buy signal in the very short term (increase the long position)
BUY-Reduce: Weakening of the buy signal in the very short term (reduce the long position)
New BUY Long: New buy signal
Neutral (Exit Long): Settle the long position
Neutral: Neutral phase (no position)
Neutral (Exit Short): Settle the short position
New SELL Short: New sell signal
SELL-Reduce: Weakening of the sell signal in the very short term (reduce the short position)
SELL-Accumulate: Consolidation of the sell signal in the very short term (increase the short position)
Strong SELL: A strong sell signal (once in position: maintain)
From Date: Indicates the last date of the current operating signal.
Priced: The price of the security when the system generated the current operating signal.
Target: The target price established by the system based on the current technical configuration.
Stop price: The limit price considered by the system to maintain the position. When this limit is reached, the system advises closing the position (the stop price is breached or exceeded by at least 1% compared to the closing price). - Trend: Indicates the Short/Medium/Long-term trend of the security identified by the system, where the short-term is up to one week, medium term is up to one month and long term is up to three months.
- Resistance/Support levels: As a general rule, an analysis of the chart shows how downward or upward movements stop at certain levels capable of momentarily interrupting the trend.
In the case of a downward trend, the level at which the downward movement is interrupted is the Support level.
Resistance level: this is a level close to which selling pressure is higher than buying pressure, resulting in a fall in prices.
R1: first relevant resistance level (a position reduction is possible because it has not been exceeded)
R2: second relevant technical resistance (a position reduction is possible because it has not been exceeded)
Support level: this is a level close to which buying pressure is higher than selling pressure, resulting in a price increase. S1: first technical support level (an increase in long positions is possible)
S2: second technical support level - 5-day range: or divergence valid for a maximum of five days, indicates the presence of bullish or bearish divergences between prices and oscillators. This information is valid for five days from the date when the divergence was found, which must be confirmed by the subsequent price movement.
A bearish divergence will be considered valid if the short- and medium-term trends are bullish and if within the 5 days after the formation of the pattern there is a negative price movement.
A bullish divergence will be considered valid if the short- and medium-period trends are bearish and if within the 5 days following the pattern formation there is a positive price movement.
5-day Resistance: this is the value around which the price may not continue its upward trend.
90% Up: first level of the expected five-day bull range. Therefore, the first target in case of resistance break.
68% Up: target subsequent to the one previously achieved.
5-day Support: this is the value around which the price may not continue its downward trend.
90% Down: first bearish target in case of support break.
68% Down: second expected bearish level.

Click on "Previous levels" to open a new window showing all significant levels of the security analysis.
> Where can I find the technical analysis of each security?
In the security information sheet you will find the Analysis button, as shown in the following picture:

In the MARKETS > MARKET VIEW > Analysis section of the website there is also a specific area with the main buy and sell signals of leading securities in the European and US index series.
The following picture is an example from the analysis of FTSE100 securities with summaries of the short-, medium- and long-term analysis.

News
With Fineco you can access 4,000 real-time news items a day about markets, rates, currencies and financial data, to have an overall view of market trends. The NEWS CENTRE is easy to access from the Markets area.

In this area you will find:
- Over 4,000 real-time news items a day from Reuters, MF-Dow Jones and Morningstar.
- 17 news categories including European and US stock exchanges, Borsa Italiana, financial data, daily agenda, press overview, sport and technology.
- List of securities covered by each news item with a direct link to the listing.
- Full text search by keywords and advanced search with filters.
- Search results sorted by date or by relevance (the most important news items are displayed first).
- News integrated in the listing page of the security.

The NEWS area also contains two sections:
- Economy and sentiment: news items with the greatest financial impact
- Movers: the best and worst security and the Most- & least-traded security
The MARKETS area also includes the “Main economic data” section containing macro data with the time, the flag of the country of reference, the description of the data, the current price (a hyphen"-" will be displayed until this is published), the forecast price, the previous price and an indicator showing the impact of that price on the markets.

Client Sentiment
Client Sentiment
This section contains the main sentiment indicators developed based on trading information gathered from Fineco customers. The sentiment is not always available and the data will display only if there is sufficient trading activity on the instrument.
Net long/short bar
The net long/short bar indicator shows the percentage of net long/short positions on the CFD.
Daily/Weekly change
The daily/weekly change indicator shows the percentage change compared to the closing data of the previous trading day / same trading day of the previous week:
-Change in long positions
-Change in short positions
-Change in open interest (open contracts)
Data is updated hourly. During closed market hours, the values displayed refer to the last available stock market day.
Example:
On day T there are 75 net long positions and 25 net short positions on Apple CFD, for a total of 200 open contracts.
The net long/short bar will show 75% long and 25% short.
On day T + 1 there are 50 net long positions and 50 net short positions on Apple CFD, for a total of 150 open contracts.
The net long/short bar will show 50% long e 50% short.
Daily Change indicator will show:
- Long: - 25/75*100= - 33,3%
- Short: 25/25*100= + 100%
- Open Int: -50/200*100= -25%
On day T+7 there are 25 net long positions and 75 net short positions on Apple CFD, for a total of 300 contracts.
The net long/short bar will show 25% long and 75% short.
Weekly Change indicator will show:
- Long: - 50/75*100= - 66,6%
- Short: 50/25*100= + 200%
- Open Int: 100/200*100= + 50%
Indicators
The "Indicators" section in the breakdown of the selected security contains fundamental analysis data for that security, provided or processed by Reuters.
To help you read these data, the specific legend is provided below:
Capitalisation
This is the company’s stock market value, calculated by multiplying the total number of shares by their unit price.
Cash flow per share
This is the ratio between the cash flow and the number of the company’s ordinary shares. With the increase of this indicator, the financial strength of the company increases as well.
Dividend per share
This is the remuneration paid to the holder of shares in the company. Dividends are usually paid once a year by Italian companies and quarterly by those in America.
EBITDA
This indicator (Earnings Before Interest, Taxes, Depreciation and Amortisation) shows the revenue of a company based on its ordinary business operations. It is calculated by subtracting the operating costs from the revenues, i.e. those directly related to production (excluding interest, taxes, depreciation and amortisation).
EBT
This indicator (Earnings Before Taxes) represents the amount of profits before tax but after the payment of interest to the holders of long-term bonds.
EPS
EPS (Earnings per Share) represents the portion of corporate profits due to the holder of an ordinary share. It is calculated by dividing the Operating Profit (net profit after tax, interest paid to bondholders and dividends to holders of savings or special stocks) by the number of existing securities. The EPS can be used to calculate the profit attributable to each ordinary share and therefore enables evaluating the profitability of the company: in theory, higher earnings are followed by higher dividends and higher stock prices.
Turnover per share
This is calculated by dividing the turnover by the number of ordinary shares.
Current Liquidity Ratio (Current Ratio)
This is the ratio between the current assets and the current liabilities of a company. It measures the ability of a company to repay short-term debts and is therefore a measure of the company's current liquidity ratio.
Instant Liquidity Ratio (Quick Ratio)
This is the ratio between the liquidity (immediate + deferred) and the current liabilities (maturing within the year). Values between 0.33 and 2 indicate on average a satisfactory situation, values below or above these thresholds respectively indicate a financial imbalance or excessive liquidity.
Total debt/ Equity proceeds
This is the ratio between the various components of the corporate debt and its equity proceeds. It may be calculated as follows: 1) dividing the total liabilities by its own equity proceeds (in this case attention is focused on the guarantee offered by its equity proceeds in the event of liquidation); 2) dividing only the medium/long-term debt by the company's equity proceeds (in this case the possible use of the debt to finance investments is evaluated); 3) dividing the total long-term debt and the preferential shares by its equity proceeds (in this case, the focus is on the relationship between the securities which have a nearly fixed income and variable-income securities).
Cash flow per share
This is the ratio between the cash flow and the number of the company’s ordinary shares.
Pre-tax margin
This represents the profits of a company before any type of tax has been deducted.
Gross margin
This represents the difference between the net total turnover and the cost of sales.
Net profit margin
This represents the company’s profit, net of taxation.
Price/Cash Flow
This is the ratio between the market capitalisation and the cash flow (net profit + depreciation). It shows the time required for the amount invested in shares to return to the investor as a cash flow. This indicator is used mainly to evaluate companies that operate in sectors requiring high initial investment costs and therefore with a high depreciation which affects the net income.
Price/Turnover (Price/Sales or P/S)
This is the ratio between the market capitalisation and the company’s turnover and it indicates how many times the market has valued the turnover. It is an important indicator especially for companies in the start-up phase, as they usually produce losses instead of profits and for which there is thus no point in calculating the Price/Earnings ratio.
Price/Earnings (P/E)
This indicates how many times the market capitalisation (and thus the value) of the company exceeds the generated profits. This parameter is very often used in order to have an idea of the value of a security compared with other similar ones. On average a P/E higher than 10-15 indicates an overvalued security, but in more traditional sectors a lower P/E ratio compared to more innovative sectors is expected.
Price/Book Value (P/B)
This is the ratio between the market capitalisation and the book value (or net worth): the difference between these two values is called goodwill. This multiple allows you to compare the net worth given by the market (capitalisation) with that expressed by the company's balance sheet (net worth): usually a value lower than 1 is a signal that stock are undervalued. As for the price/turnover ratio, the P/B is also useful in the case of companies which show losses.
ROA (Return On Assets)
This indicates how much a company is profitable in relation to its invested capital (assets). It is calculated by comparing the net income to the total assets reported in the financial statements.
ROE (Return On Equity)
This indicates how much profit is generated by the company with the resources invested by shareholders. It is calculated by dividing the net profit by the company's equity proceeds and it is useful to compare returns generated by similar companies.
ROI (Return On Investments)
This indicates the profitability and economic efficiency of management, regardless of the sources used. It is calculated by dividing the operating income by the costs incurred and therefore gives the result obtained by investing €1 of capital.
Book value per share
This is calculated by dividing the company's book value (net worth) by the number of ordinary shares. The tangible book value (net worth) is obtained by subtracting the intangible assets from the net worth.
Pivot Points
A pivot point is a technical analysis indicator, or calculation, used to determine the overall trend of the market over different time frames. The pivot point itself is simply the average of the high, low and closing prices from the previous trading day. On the subsequent day, trading above the pivot point is thought to indicate ongoing bullish sentiment, while trading below the pivot point indicates bearish sentiment.
Daily Pivot Points are calculated using the following formula:
Pivot: (min t-1 +max t-1 +close t-1)/3
R1: 2*Pivot – Min t-1
S1: 2*Pivot – Max t-1
R2: Pivot + ( R1 – S1 )
S2: Pivot – ( R1 – S1 )
R3: Max t-1 + 2* (Pivot – Min t-1)
S3: Min t-1 – 2* (Max t-1 – Pivot)
Consensus and analysis
Reuters gives Fineco consensus for securities on Italian, US, German and French markets, along with a list of baskets of indices with buy and sell signals calculated on the basis of fundamental assessments.
What is consensus?
This page is divided into three sections:
1. Broker rating

Ratings are based on all broker ratings for a given security, translated as buy and sell consensus.
The Buy-Sell scale used has 1= Buy and 5=Sell.
Ratings are explained as follows:
Buy = Enter a Buy order
Outperform = Buy with moderation
Hold = Hold the security position
Underperform = Sell with moderation
Sell = Enter a Sell order
Example
If in the Today column number 10 is next to the Buy rating, this means that ten of the analysts have given a favourable opinion for buying the security in question.
> The Advice section is a single data item with the overall result of analyst ratings. The weighted average can be interpreted based on a scale from 1 (Strong Buy) to 5 (Strong Sell).
Example
If in the Today column a consensus average of 2.42 is displayed, this means that on average the ratings given tend to advise holding the security rather than selling it.
How is the consensus average calculated?
A weight is assigned to each rating, from 1 (Buy) to 5 (Sell), after which the weighted average of the number of analysts giving their ratings is calculated.
Example
With a Buy given 1 and a Sell given 5, if 6 analysts give a rating of Buy, 4 Buy, 2 Hold, 0 Sell, and 1 Strong Sell the formula (6*1+4*2+2*3+0*4+1*5)/13=1.92 indicates the value of the Consensus Average.
2. Unexpected Earnings per share (EPS)

> Earnings Per Share (EPS) is calculated as the ratio of a company’s profit divided by the number of treasury shares. Earnings Per Share takes into account any capital increases and reflects which part of the company’s profit will increase the value of each single share.
If earnings per share decreases, the following situations are possible:
- The company’s profit has decreased.
- Earnings per share have increased but the company has raised new funds, with new shareholders subscribing.
Earnings per share are indicated in GBP (or in other currencies according to the security).
> Unexpected EPS : the Unexpected EPS is calculated as the percentage difference between the last EPS reported by the company and analysts’ forecasts for the same data.
E.g. if analysts estimated that the EPS for the security in the previous quarter would have been 0.59 but actual EPS was 0.56, the surprise is -5.72%.
Often a more or less considerable surprise can cause significant movements in share prices.
3. Estimated trend and Forecast

> Estimated trend (in millions of pounds): this represents analysts' forecasts for annual and quarterly turnover, possible profit, earnings per share and expected dividend payout.
Example
If the EPS (Earnings per share) row for the current year shows Estimates 13, average 0.60 - max 0.69 and min 0.53, this means that 13 analysts have forecasted that in the current year the security will reach a minimum EPS of £0.53, a maximum EPS of 0.69 and thus an average EPS for the current year of £0.60.
> Forecast: This summarises the medium and long-term forecasts for turnover, profit and growth of the analysed security.
P/E: this shows how often a company’s profit stays within the value attributed by the market.
P/E is obtained by dividing the price of a share by its earning per share, but the same result can be obtained by dividing market capitalisation by the company’s net profit.
How to access the consensus section
From the security information sheet, click on the consensus link to open this section.

In addition to this customised analysis for each security, consensus for securities is also provided in the pages with the analysis of baskets in the Markets > Market view > Analysis section.

The Book
The Book is a fundamental tool for information on the bid and ask prices exchanged on the market at any given time. The Book of a security shows the five lowest sell prices and the five highest buy prices currently present in the EDP Stock Exchange for a given security.
For each price, the quantity of securities being traded and the number of transactions (#) in progress is given.
The left side of the chart concerns the buy orders (bid price), while the right side concerns the sell orders (ask price) entered into the system by the operators.
The first row summarises the last quote for the security.
The Fineco book adds the data on prices to the order entry screen in push mode. This means that in one window you have the book information updated in real time and the order entry screen.
The Book is quick, compact and allows you to maintain 9 windows open in push mode at the same time and an unlimited number in pull mode. This way you can send several orders in quick succession, including short selling and stop loss orders.

How do I access the Book?
- From the website:
You can find the Book link on the security quote pages. - With Powerdesk:
By expanding the row of the security in the watchlist, you can integrate the book in push mode into the screen. On PowerDesk2 you can also view the Book in push mode with PowerBoard and simultaneously open up to 30 Books in push mode.
Interactive charts
Fineco provides interactive charts for each security available to buy or sell, displaying the trend of the security selected. These charts can be viewed in two different ways: interactive charts can be accessed from the PowerChart website and charts are also available on the PowerDesk platform.
The charts on the site show both the intraday and historical trends of a security.
As the charts are interactive, you can change the time interval for displaying the security, from intraday to daily, monthly or annually, up to the maximum depth of the historical series of the security.
You can also:
- Customise chart analysis by applying superimposed advanced statistical indicators such as MACD, Fast/slow stochastic, RSI, ADX, Williams %R and Volume Rate of Change, or separate indicators, such as exponential and weighted moving AVERAGES, Bollinger Bands, Price Channel and Parabolic SAR.
Click on the Superimposed indicators or Separate indicators buttons to open a dialogue window where you can select the indicator, read a brief description of it and customise the parameters.
Click on to display the selected indicator directly in the chart or in a box below the Volumes chart.
 - Use the Chart Type button to select the type of chart you want to use: linear, candlestick, bar, mountain or OHLC.
- Compare the performance of one security with other financial instruments, such as other shares, Futures, Forex currencies and indices.
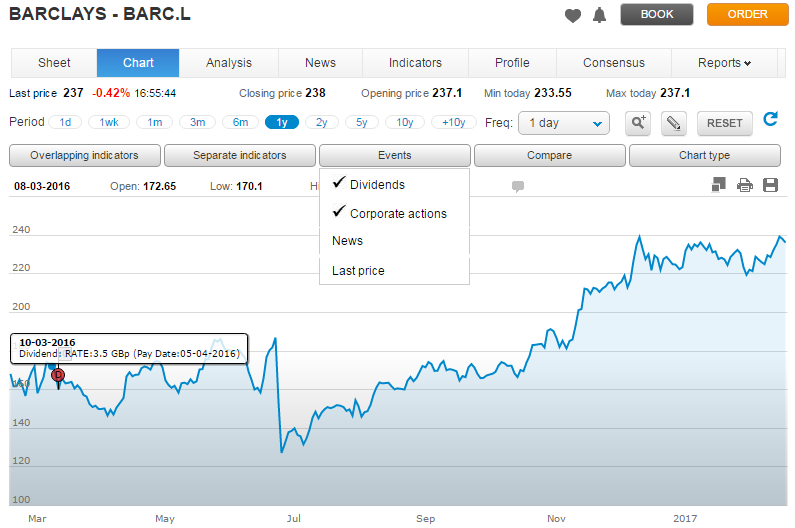
- Display directly from the chart dividends paid, capital transactions and specific news about the security on the date of payment or publication. Position the cursor on the respective icon to see details about transactions and read the news article.
- You can use the scroll bar to control all historical data; by clicking on the
 icon you can zoom into a part of the chart.
 - Use the cursor
 to dynamically display the Date, Opening, Minimum, Maximum, Closing prices, Targets and the Volumes or values of the oscillators selected (charts at the bottom). By keeping the left mouse button pressed on the chart, you can scroll all the historical data in the chart.
 - Click on the
 icon to trace a trend line, support or resistance level. The trendline can be free, horizontal and vertical. The simple trendline indicates the % of variation and the deviation between one point and the other of the straight line.
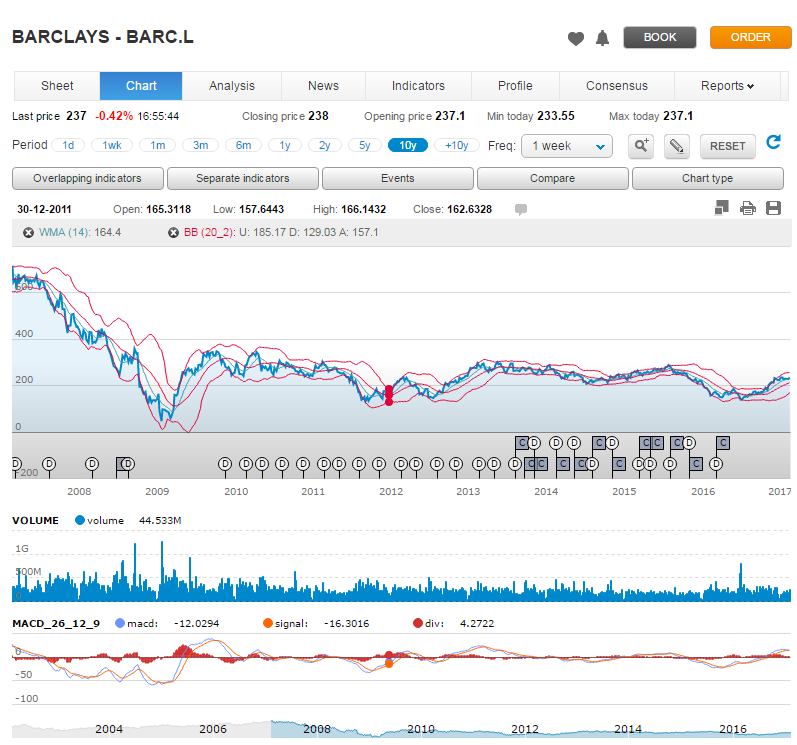
In addition:
- The Java chart can be displayed in full screen mode by clicking on the "detach/attach"
 icon: the chart will detach from the page and you can manage it like a normal window.
 - If data are not displayed correctly, just click on “refresh
 . You will not lose data already configured in the chart.
 - To delete a study, simply click on
 .
.
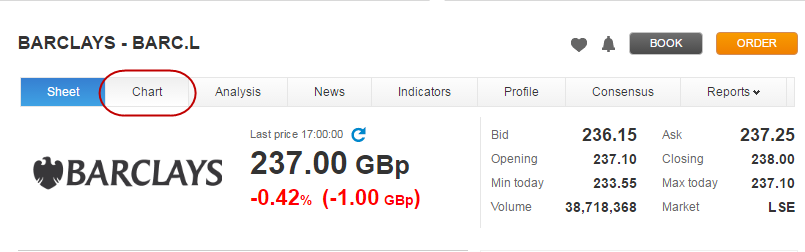
How can I access the interactive charts on the site?
In the security information sheet you will find the CHART tab, as shown in this image:
Alerts
What is a price alert?
The Alert service advises you when a security you own or are monitoring exceeds a certain price. So you can monitor your securities even when you are not in front of your computer.
You merely have to specify a condition (e.g. “If the price of the ABC security drops below £3.2”) and indicate how you want to receive the alert notice (e.g. “Notify me by text message” or “By email”).
How it works
To set an Alert or a Conditional Order, go to the security information sheet you are interested in and click on the  symbol.

What can I do?
- Select the period when you want to “monitor” the security (up to a maximum of 30 days)
- Define the price level that the market must reach (greater, greater than or equal to, less than or less than or equal to)
- Configure the system to receive alerts (by email or text message).
From the PORTFOLIO area in the “Protection, conditions, alerts” page, you can check your active alerts at any time and their expiry, and have a list of the last 10 alerts activated, deleted or expired, with the relative dates.

What conditions have I set?
- These are online services: alerts cannot be activated through the free phone number.
- For conditional orders only, the system does not work during market After Hours.
- You can have up to 30 alerts active, for any security.
How much does the service cost?
Sending alerts by email is free of charge. Sending alerts by text message has a cost that is debited directly from the telephone credit.
Conditional orders are subject to the same fees as those applicable to normal trading transactions.
Stop Loss and Take Profit
Stop Loss and Take Profit are price levels that represent, respectively, the maximum loss that you are willing to bear and the target price at which you wish to close the position, whereas the Trailing Stop lets you protect your orders dynamically.
These can be entered during the order entry phase or later on from the Orders Monitor page, either through the web platform or using PowerDesk.
By clicking on the "Protect order" link, the PowerBook expands to give the option of entering Stop Loss, Take Profit and Trailing Stop conditions.

These features, which can be used on the website or from the PowerDesk platform, let you decide in advance the entry and exit levels of a security in terms of Stop Loss and Take Profit.
A numerical example might help to explain this function: you may decide to open a long position on the GLAXOSMITHKLINE security, setting the purchase price for the security, at GBP 1,639.50 (10 shares) for instance and, at the same time, enter two mutually exclusive conditions (when the first is met, the second will be cancelled) such as Stop Loss (GBP 1,601.00) and Take Profit (GBP 1,701.00).
Suppose that when the order is entered, the GLAXOSMITHKLINE price is GBP 1,639.50 so your order is executed immediately. From that moment, your Stop Loss and Take Profit conditions are active. When the first is met, for instance the Take Profit (GBP 1,701), the second will be cancelled by Fineco and your position will be closed.
This feature therefore lets you protect positions even before they are executed by fixing the entry and exit levels for the security.
Important: During the After Hours Trading phase, Stop Loss (and Fineco’s automatic stop) and Take Profit conditions are not active. However, they can be entered, edited or cancelled.
Lists of baskets
Lists of baskets of the most important indices of the UK, European and US markets, updated in real time, are available on the website.
Wherever you are on the site, you can always display the percentage change in market indices compared to the closing of the previous session

and open the respective basket list.

In each list you can:
- Click on
 to enter the security in your personalised list
 - Open the order entry screen, by clicking on
 and open the security information sheet by clicking on the name. This sheet includes quotes as well as the book, interactive charts, the technical analysis page, the consensus data sheet and list of covered warrants (as applicable).
 - Understand the performance of each security, based on the last price traded, the percentage change in the last price compared to the closing of the previous trading session and the time-minute-second of the last update of the security.
Trading Lists
With the securities list, you can save and monitor all securities you are interested in and want to monitor. You can keep track of up to 50 securities and, for each one, find out in real time the price (bid price-ask price) and quantities traded.
This is a useful way for optimising available space and time, and keeping up-to-date so that you are ready to trade at the right time.
With Fineco, the securities list can be automatically updated (DATA IN REAL TIME) for more dynamic, discerning customers. You can thus operate even more efficiently and accurately, from a single screen from your computer.

In the image: detail of a possible securities list
For each security in the list you can see the following values:
- Price - the last market exchange price of the security
- Var% - The deviation as a percentage between the Last Price and the reference price of the previous day
- Bid price - The price of the best buy proposal currently on the market
- Ask price -The price of the best sale proposal currently on the market
- Volume - The total of shares traded during the entire trading day
- Time - The time when the last trade took place at the Last Price
The key allows you to operate at the right time simply and quickly: just click on the key to access the order screen.
The  key allows you to access the book directly to enter the order.
Use the  key to delete the security from your securities list.
Portfolio
The portfolio allows you to display your security positions at any time. The summary portfolio shows the updated situation of the entire portfolio.

For each security there is a set of data:
- The ORDER key. Click to enter a sell or buy order for the corresponding security.
- Security: The name of the instrument in the portfolio
- Instrument: the type of instrument you have invested in
- The Currency in which the security is traded
- Size: the quantity of financial instruments held
- Average book value. The average price at which the securities were bought. From the day after the purchase, the price also includes the fees paid. For Bonds, it is the clean price paid
- Market Price. The last market exchange price of the security. This information is updated in real time. Please note that, in the case of Bonds, it is the clean price
- Market Value This is the current theoretical value of the securities. It indicates what would be the equivalent receivable from the sale of the securities, provided the market price remains stable. It is given by the number of shares or the nominal value of bonds held, multiplied by the Current Market Price.
- The % Change is the current theoretical value of the securities. It indicates what would be the equivalent receivable from the sale of the securities, provided the market price remains stable. It is given by the number of shares or the nominal value of bonds held, multiplied by the Current Market Price.
- The Var £ and Var % change, expressed as a percentage and in absolute terms, indicates the profit or theoretical loss for the single security, calculated at current prices.
Note: The portfolio simultaneously displays the values of the transactions in GBP and Dollars in the corresponding currencies. Totals are displayed and converted instead into GBP.
In addition to the summary portfolio, you may also see the individual portfolios grouped by instrument

Interest-bearing portfolio
What is an "Interest-bearing portfolio"?
With this service you can receive a remuneration on securities in your portfolio. This is an opportunity in which Fineco offers you the chance to earn liquidity by lending your Italian and foreign securities, a great opportunity to make your Fineco account even more advantageous.
Whether your securities are borrowed or not depends on operator demand. But if they are, each day you can earn a small amount which is automatically credited to your current account once a month.
How it works
From a technical point of view, you earn interest on your securities because by activating the service you authorise Fineco to borrow them in order to pass them on to institutional investors, to whom they can be useful for various purposes, for example structured transactions or hedging operations. As far as you are concerned though, the service is entirely transparent: the securities always remain at your disposal, because the loan is structured so as not to condition your normal trading on the market.
How much does it cost?
Nothing. Indeed, the service allows you to earn a fee, which is accumulated and paid in a single amount, directly into your current account.
How much does it yield?
Each transaction has a clear earning, and is calculated by multiplying the number of your securities by the reference price of the day and by the rate of return on that security for that day. On the Home Page in this section you will find the table with the rates of return on securities applied for that day. Since each transaction is daily, the return for each day will be small, because the rate of return refers to the year, but the sum of these small amounts may grow to high levels if you own many securities and if your securities are borrowed every day.
For American securities, if your account is not in dollars the exchange rate for matured credits in the other currency will be applied on the last day of the month.
Security information sheet
For all securities traded through Fineco, the security information sheet provides a detailed and accurate overview of performance trends.
It can be accessed from the Markets and trading section by selecting a security from the basket and clicking on its name.

The information sheet contains the following information:
- The updated listing of the security and first-level book prices
- In an interactive chart
- The breakdown of returns after 1 year, 3 months and 1 week and budget data used for the fundamental analysis
- The latest news specifically concerning the security

- A brief overview of the company
- The Consensus and opinions table with overall and summary results of the analysts' ratings for the instrument

- The list of securities worldwide by sector and capitalisation (data from Reuters)
- The chart of most popular securities with information about the number of Fineco's customers who hold the security in their portfolios.

Consensus and opinions
The overall and summary results of all the analysts' opinions for every security listed on the Italian, American, German and French markets are displayed in the security’s information sheet.
The pie chart shows the distribution of the different opinions expressed by the total number of analysts.
A weighted average is calculated on the basis of these opinions and the result reflects the consensus concerning the security which is then referred to as "The analysts’ opinion".

Do you agree with the analysts’ opinion?
Next to the analysts’ opinion, you can see customers' opinions received during the last week.
Click “YES” if you agree with the analysts’ opinion or “NO” if you think that the analysts have made a mistake in judging the security.
Your opinion will be saved and displayed directly in the security information sheet along with other customers’ opinions.
Note: you may not vote more than once for the same security on any one day.
Chart of most popular securities
The “Fineco Customers” in the graph are customers who have consented to the processing of their personal details for commercial purposes pursuant to Italian Legislative Decree. 196/2003 (the Privacy code).

Source: Internal processing of Fineco customer data (see above). The percentage shown refers to the number of customers with the specific security in relation to the number of customers with the same asset class in the portfolio.
Market view
The Market view section provides full information, in real time, about market performance and the instruments for a detailed analysis of the situation of each security. In this section you can:
- Immediately see how the main international indices and currencies are performing, and the interactive map shows which markets are open and closed at the specific time.
- Read the day's most-read news and the latest news about securities traded on world markets, in real time
- Consult the list of the day's most relevant securities in terms of their performance on the stock market and volumes traded
- See the chart of most popular securities to find out which 10 securities were "most popular", "most traded" or "most observed” by Fineco's customers yesterday.
- Display the economic calendar with the publication of worldwide macro-economic data in real time.
Trading lists
Up to 3 Trading Lists are available for you to save and monitor up to 50 securities that are of interest to you.
Create your lists by clicking the "+" tab on the page.
By clicking the  icon on each tab, you can rename the added lists (max 12 characters) or delete them at any time.

To add an instrument you wish to monitor to the list, click on the icon on the pages of the website referring to each security or fund.
Alternatively you can use the search hints on the page to select one or more instruments from among those classified as the most popular in Fineco and add them to the list.
Note: List 1 is the default list and cannot be deleted or renamed.
Use the Drag&drop function to select and drag the securities to the list you prefer. This makes it easy to organise the list based on your needs.

The favourites set with drag&drop will be saved and displayed automatically when you return in the future. Click on the "Name" column heading to arrange the instruments in the table in alphabetical order. This change will also be saved automatically.
Notes:
- The last change made, both using drag&drop and by clicking on "Name" will be saved and shown next time you return.
Therefore, if securities are moved with drag&drop and you subsequently click on “Name”, the instruments will be rearranged and saved in alphabetical order, thus losing the changes made using drag&drop. - The changes made to List 1 can also be seen from the apps for Apple, Android and Windows Phone 8.
The data in the list of your favourites are shown in real time. To update them click on the refresh icon .
Alternatively you also use the “ACTIVATE PUSH” button to view the security prices in push (with continuous and automatic updating).
Use the links at the bottom of the page to export in Excel or print your securities list.
Fineco customer securities
The graph shows which 10 securities were the "most popular", most traded" or "most observed" by Fineco's customers yesterday.
The size of the circles represents the classification of the securities. The biggest circle indicates the most popular, most traded or most observed security and the smallest circle indicates the least popular, least traded and least observed security from among those ranked as the 10 "most popular".
The selection of these securities always refers to the previous business day. At the end of the day all transactions on securities are recorded and the result of this analysis is published on the website the following day.
The “Fineco Customers” in the graph are customers who have consented to the processing of their personal details for commercial purposes.
Source: internal processing of data from Fineco customers, pursuant to Legislative Decree 196 of 30 June 2003 (Privacy Code).
For full details about how and why Fineco processes your personal data, please refer to the Privacy section at the bottom of each page of the website.

- THE MOST POPULAR SECURITIES
These are the securities held yesterday (or more precisely, on the previous business day) in the portfolios of Fineco's customers.
The most popular security is defined by considering the number of customers who held that specific security in their portfolio without considering the number of shares held or the amount invested.
-THE MOST TRADED SECURITIES
These are the 10 securities with the highest value traded by customers on the previous business day.
The most traded securities are defined by considering the number of customers who traded in those securities, without considering the volume of trading.
- THE MOST OBSERVED SECURITIES
The 10 securities most present in customers' lists of favourite securities on the previous business day, i.e., the securities that the most customers chose to include in the list of favourites.
How to read the chart
The 10 securities are shown in a chart with the volumes traded on the horizontal axis and the change in price on the vertical axis. Data are in real time. This allows you to see how customers' favourite securities are behaving at this moment.
Securities traded the least by value are shown on the left side of the chart, those traded most on the right.
The size of the circles represents the greater / smaller presence of the individual security in customers’ portfolios.

The percentage change in the security, which is also shown in the circle, determines its vertical position on the graph:
- The more positive the change, the higher the circle on the chart, which is shown in green
- The more negative the change, the lower down on the chart, which is shown in red
- When the change is in the region of 0%, the security is shown in the middle and the circle is a neutral colour.
Economic calendar
The Economic calendar displays the most significant expected economic events in the United States and in the rest of the world, in real time.
In the table there is a list of all the appointments, economic data and macro-economic indicators together with a brief description and their respective importance on the markets.

The description of each single event includes details of the macro-economic data.
Order types

IOC and FOK market orders
There are two types of Market order:
- An IOC Market order that allows you to enter an order without indicating a specified price, that will be executed (possibly partially) at the time that it is entered. Any quantity not met at the set price will be automatically cancelled.
- An FOK Market order that allows you to enter an order without indicating a price, that will be executed only if the book contains enough to cover the quantity in full, otherwise the entire order is automatically cancelled.
Remember that an IOC Market order seeks to fulfil the quantity entered on all the book levels and if this quantity is insufficient, it cancels the surplus part of the order. However, FOK Market orders are cancelled in full if the full quantity entered is not met.
Market orders ensure execution of the order by scanning the book until the set quantity is met. When the market order is sent it is no longer possible to "hit" only the quantity available at the first level of the book.
Note: For securities traded on Borsa Italiana, any IOC or FOK Market orders entered during the auction phase (opening, volatility, closing) will be refused by the system.
If an auction order is used during the continuous trading phase, the consequences will be those of a market order.
Automatic Orders
All automatic orders (Stop Loss, Take Profit and Trailing Stop) will be sent to market as IOC Market orders.
Operating note: Remember that for every IOC or FOK Market order entered, our systems withhold 10% more liquidity than the total equivalent value of the order.
Limit Orders
As the name suggests, a limit order sets a specific buy or sell price threshold. Unlike a market order, which guarantees order execution but not the price, a Limit order allows you to determine both the maximum price you intend to pay for a buy transaction and the minimum price for a sell transaction, so order execution is not guaranteed.
In other words, if the security you want to buy has a lower price than the limit price in your order, the order will be executed at the limit price or a lower price. Likewise, for a sell order, if the security is listed at a higher price than your limit, the order will be executed at the limit price or a higher price.
For a buy order with limit price:
- Use the ask prices in the book as the reference; these represent the minimum price at which the market is selling
- Set the limit price as the maximum price at which you are prepared to buy
Your order will be executed at the limit price or at a lower price.
For a sell order with a limit price: the cash quotes in the book represent the maximum price at which the market is buying a security.
Set the limit price as the minimum price at which you are prepared to sell. Your order will be executed at the limit price or at a higher price.
If the market is closed, orders placed that remain in force for one day (unless automatically cancelled) will be executed the next trading day.
Placing an order
For your order to reach the market, you must fill in all fields of the order.
In many areas of the website (e.g., portfolio, favourites, monitor) you will see this button:

At the top, you have all the data relating to the security price, the maximum amount that you can buy or sell and the updated situation of your current account.
At the bottom you can see the details of the order you are about to place:
- BUY or SELL
- The number of securities you plan to buy
- Price: IOC Market, FOK Market, Limit
- Expiry date: in this field you can choose how long the order should be valid for: until the markets close, or until a specific date which you can select using the drop-down menu (for Limit orders only).
Important: for securities not traded in After Hours Markets, the revocation of any UFN orders (valid until further notice) may not be successful. You may want to revoke these orders during continuous trading or after the After Hours Market closing.
Once you have clicked on order, a summary window will be displayed where you can check the order data once more.

If the data are correct, you may enter your PIN and submit the order. You may also decide that the PIN is not required any more for the trading session: this will make it easier for you to submit subsequent orders.
Once you have clicked the order button, you will see the result of the order received by Fineco:

Click the print key to print the order you have just placed.
Once you have finished entering the order, you can check its status in the Orders Monitor area.
Remember, you cannot enter a sell order if the security is not in your portfolio.
The system is designed and tested to be used in a single browser window and to execute one order at a time. We therefore advise you not to prepare and confirm several orders simultaneously.
The simultaneous use of multiple sessions with the same user code could result in display delays or the generation of error messages.
Please also note that, as indicated in the general terms and conditions, the codes are strictly personal and non-transferable.
Trading tick
A tick is the minimum change between two prices that can be entered on the market and represents the fraction of a predefined unit of the currency the security is traded in (e.g. £0.002). Orders entered on a financial instrument are always multiples of the trading tick valid for the instrument considered.
The tick size is determined on the basis of the Average Daily Number of Transactions registered on the most relevant market in term of liquidity of each share (“ADNT”).
LSE and Borsa Italiana associate each share with the tick size table (one of the six standardised tables defined by CDR 2017/588 available via this link https://eur-lex.europa.eu/legal-content/EN/TXT/PDF/?uri=CELEX:32017R0588&from=EN) determining the minimum tick size permitted by MiFID II.
Orders Monitor
Click the Portfolio - Orders Monitor to enter the area where you can monitor the status of orders you have placed on the market. The Orders Monitor is divided into several sections:

Shares, ETFs, and Options Monitor This screen shows the status of placed orders and prices of executed orders.

The following elements are displayed:
- At the top left you can select the type of trades you have entered
- Status: this indicates the market feedback on the order status, which may be:
| Entered |
| Executed |
| Partially executed |
| Queued |
| To be queued the order has been received. It will be placed on the market as soon as the market starts accepting new orders (this usually happens when the market is still closed) |
| Cancelled |
| Expired The deadline for the order has expired and the order has not been executed. |
| Refused. The order has been rejected by the system or Market. There are various causes, including: a lack of funds (in the case of a buy order) or securities (in the case of a sell order); the wrong market phase (for orders placed during After Hours Trading in the case of securities not traded in this segment); any other reason why the order cannot be executed. |
- Sign: shows the type of transaction, i.e., the purchase or sale of a security
- Qty placed and Qty executed
- Price placed
- Average Price
- Market: the market the security belongs to
- Date time: the date and time the order was placed
- Protection: here you can set a stop loss, take profit or trailing stop value
- Repeat order button: to repeat the order press
 . An order placement screen pre-filled with the same characteristics will be displayed.
By clicking on the order status, you can see and print the order certificate. Use this key to cancel orders placed but not yet processed.
Monitor CFDs, Futures and Forex
In this area you can monitor the status of both long and short orders you have placed on the market. You can check the status of your positions and enter automatic orders on individual orders or on the position.


Specifically, you can see the following differences compared to the securities order monitor:
- From the drop-down menu at the top right, you can filter this screen, selecting:
- All positions
- Open positions
- Closed positions - Status: market feedback on the condition, position and order, which may be:
OPEN The (long or short) position is open CLOSED The (long or short) position is closed
Note: the monitor shows all open positions or all closed positions opened at least 30 days earlier.
- Sign: the type of transaction (Long or Short)
- Validity: Multiday or Intraday
- Date time: Indicates the maturity of the position
- SL TP: click on the
 button to set a Stop Loss or a Take Profit or a Trailing stop value on the position
 - Close: click on the
 to recover your position, entering a buy order for short positions or a sell order for long positions.
NB: orders of the last 7 days can be displayed on the monitor. To search over a longer timeframe, you can consult transactions in the securities dossier.
Click for a list of executed orders that make up your position and click
 to set a Stop Loss or a Take Profit or a Trailing stop value on the order.


Protection, conditions and alerts
In the monitor you can view the section dedicated to automatic orders, conditional orders and the active alerts set on orders and positions for all types of financial products.

From the table you can modify or revoke an automatic order by clicking on the Stop Loss, Take Profit or Trailing Stop value, or on the cancel icon.
By selecting the conditional orders section you can view simple, OCO and linked conditional orders. For each automatic order there is an expanded row showing all the details.
History
Originally established as a market for securities that could not find room on the NYSE (New York Stock Exchange), during the early 90s, the Amex began to suffer from increasing competition from Nasdaq. In addition, all projects designed to increase the number of listings (prices) were totally unsatisfactory.
So it became necessary to consider listing new categories of financial instruments, and at first attention was directed towards mutual funds which were becoming increasingly popular among private investors at the time.
Unfortunately, their design meant they were ill-suited for direct listing on the market, mainly because of the enormous difficulties which the managers of such funds would have met when managing sudden incoming and outgoing money. That obstacle was overcome by drawing on experience in the commodity field, where it was customary to deposit goods with custodian companies in exchange for depository receipts, which represented their proprietary right. This procedure allowed these goods to be purchased and sold much more directly and quickly by simply transferring the related depository receipts (a kind of "voucher" representing ownership).
Translating this logic to ETFs, the revolutionary idea was to create a basket of equity securities which replicated a specific market index and to deposit these in exchange for depositary receipts. Subsequently, each of these receipts would be divided into a large number of stocks which could then be exchanged on the market like common shares. It therefore became possible to buy and sell securities without this envisaging any profit or loss for the underlying fund.
Moreover, those who wished, or rather, those who found it profitable to do so, could once again reunite the shares in order to form the depositary receipt and hand this over in exchange for the underlying portfolio.
Thus, in 1993 the first and perhaps the most famous ETF in history was born, the S&P 500 Depositary Receipts or "Spider" destined to become the progenitor of many other products such as the equally famous "Diamonds" and "Cubes" which respectively replicate the Dow Jones Industrials and the NASDAQ 100.
On this side of the Atlantic, the history of ETFs is much shorter, but in a few years the European market has managed to achieve almost as many products as its American counterpart. The first ETF, based on the DJ EuroStoxx 50 index, was quoted on Frankfurt’s Xetra in 2000. Soon after came the ETF on the FTSE 100 national index, listed in London. Italy has also had its own ETFs since September 2002, listed on the MTF segment (Electronic Funds) of the Italian Stock Exchange. Simply specify the amount of ETFs (just as for shares) which you want to buy/sell and then click on Order.
Stock Exchange filters
In order to provide for orderly trading, Fineco has arranged and maintains automatic price and quantity control systems of the orders given by customers. These "stock exchange filters" allow the operator to conduct preventive and automated checks on all orders received, thus avoiding any anomalies that could lead to irregularities or compromise the orderly course of trading and the integrity of the markets themselves.
- Price filters
Each class of financial instruments has two thresholds: the first is a simple alert and the second an operation block. In the first case, a message warns the customer if the price entered exceeds the predetermined threshold. Once the customer has read the warning he can cancel the order or confirm it, authorising the originally indicated price to be sent to the market all the same. In the second case, in addition to alerting the customer of the price anomaly, the message causes the order to be blocked and refused. Customers who still intend to place the order can contact an operator at the Bank’s call centre (free phone 800.52.52.52) who will decide whether to send the order to the market after carrying out the necessary assessments.
The price filter is defined as the maximum deviation percentage from a benchmark used by the individual markets.
Different alert thresholds and blocks are established according to the market as shown in the following tables:
EUREX
|
EUREX/CBOE/IDEM |
% deviation (+/-) compared to the static price of Borsa Italiana |
|
| Alert | Block | |
| Futures | N/A | 30% |
| Options | N/A | 200% |
Stock markets
| Markets | Price filters | |
| deviation % (+/-) compared to the static price of Borsa Italiana S.p.A. | ||
| Alert | Block | |
| LSE | 30% | 40% |
| Euronext (France, Netherlands and Portugal) | 30% | 40% |
| Switzerland | 30% | 40% |
| Xetra | 30% | 40% |
- Quantity filters
The quantity filter considers the maximum order size that can be entered in the foreign markets to which FinecoBank offers direct access. Also for this type of filter there are two threshold levels:
> Lower threshold, which if reached triggers a visual alert to advise the customer that the limit established by the Bank has been exceeded. The customer can cancel the order or confirm it, authorising it to be sent to the market.
> Upper threshold: when this is reached it displays that your order is rejected. Customers who still intend to place the order can contact an operator at the Bank’s call centre (free phone 800.52.52.52) who will decide whether to send the order to the market after carrying out the necessary assessments.
The thresholds have been determined according to the type of customer.
Based on the equivalent value of the orders, two types of customers have been identified:
1. Customers that have executed orders with a maximum equivalent value exceeding 50,000 or €100,000 (heavy traders)
2. Customers that have executed orders with a maximum equivalent value of less than £50,000 or €100,000 (other traders)
Market
|
Type of financial instrument | Online retail customers |
||||
| Heavy traders | Other traders | |||||
| Higher threshold (refusal) | Lower threshold (warning) | Higher threshold (refusal) | Lower threshold (warning) | |||
| LSE | All stocks | £1,000,000 | £500,000 | £100,000 | £75,000 | |
| Xetra | All stocks | €2,000,000 | €1,250,000 | €250,000 | €225,000 | |
| Euronext Virtx20 |
All stocks | €2,500,000 | €1,250,000 | €250,000 | €225,000 | |
Equiduct - maximum counter-value
Equiduct is a regulated market mainly created to provide dynamic Best Execution for retail customers, which generally send orders to the market that have a lower counter-value than institutional customers. Equiduct is a suitable market for retail trading and investing and is less suitable for institutional trading with large counter-values.
The market makers that provide the liquidity to the Equiduct market can also manage orders with relatively high counter-values, provided that these are sent to the market in more than one tranche.
The market guarantees dynamic Best Execution up to a preset counter-value communicated and made available ex ante by Fineco; the maximum counter-value is determined by the market maker and is calculated based on the liquidity of the security and its volatility.
Generally, this maximum counter-value is such not to considerably affect or limit the trading of retail customers and varies from a minimum of €25,000 to a maximum of €150,000 according to the market and the security:
| Market | Maximum counter-value |
| Germany | from €20,000 to €150,000 |
| France | from €2,000 to €300,000 |
| The Netherlands | from €25,000 to €300,000 |
| Portugal | €50,000 |
Borsa Italiana filters
According to Borsa Italiana Regulations, in order to provide for orderly trading Fineco has arranged and maintains automatic price, quantity and frequency control systems of the orders submitted by customers. These "stock exchange filters" allow the operator to conduct preventive and automated checks on all orders received, thus avoiding any anomalies that could lead to irregularities or compromise the orderly course of trading and the integrity of the markets themselves.
> Price filters
Each class of financial instruments has two thresholds: the first is a simple alert and the second an operation block. In the first case, a message warns the customer if the price entered exceeds the predetermined threshold. Once the customer has read the warning he can cancel the order or confirm it, authorising the originally indicated price to be sent to the market all the same. In the second case, in addition to alerting the customer to the price anomaly, the message causes the order to be blocked and refused. Customers who still intend to place the order can contact an operator at the Bank’s call centre (free phone 800.52.52.52 ) who will decide whether to send the order to the market after carrying out the necessary assessments.
The price filter is defined as the maximum deviation percentage, with respect to the benchmark, which is given by the static price fixed by the Italian Stock Exchange for the various financial instruments.
Different alarm thresholds and blocks are established according to the type of market and financial instrument as shown in the following tables:
Euronext Milan - Italian Stock Market
| Euronext Milan | Price filters | |
| deviation % (+/-) compared to the static price of Borsa Italiana S.p.A. | ||
| Instrument | Alert | Block |
| Stocks | 60% | 80% |
| Warrants | 60% | 80% |
| Rights | 60% | 80% |
| Convertible bonds | 60% | 80% |
| Indexed UCI (undertakings for collective investment) shares or quotes | 20% | 24% |
| ETC without leverage effect | 20% | 30% |
| ETC with leverage effect | 30% | 50% |
EuroTLX
| EuroTLX | Price filters | |
| Instrument | Alert | Block |
| EuroTLX | 9% | 10% |
The limits described above are subject to change and updates by EuroTLX SIM S.p.A. For details please refer to the bond’s information sheet available on the EuroTLX market website.
MOT - Italian Bond Market
| MOT | Deviation % (+/-) compared to the static price | |
| Instrument | Alert | Block |
| Stocks | 6% | 10% |
| Warrants | 12% | 30% |
| Rights | 12% | 30% |
SEDEX - Covered Warrant market
| SEDEX | Deviation % (+/-) compared to the static price of Borsa Italiana S.p.A. | |
| Price range (euros) | Alert | Block |
| < = 0.003 | 300% | 400% |
| 0.0031 – 0.3 | 100% | 2200% |
| 0.3001 – 1.5 | 60% | 100% |
| 1.5001 – 3 | 50% | 80% |
| 3.0001 – 30 | 20% | 80% |
| Above 30 | 10% | 40% |
IDEM - Italian derivatives market
| IDEM | Deviation % (+/-) compared to the static price of Borsa Italiana S.p.A. | |
| Alert | Block | |
| Futures on FTSE MIB | N.A. | 30% |
| Mini Futures on FTSE MIB | N.A. | 30% |
| Options | N.A. | 200% |
> Quantity filters
The quantity filter takes into consideration the maximum order size that you can enter on the markets managed by Borsa Italiana. Also for this type of filter there are two threshold levels:
- Lower threshold, which if reached triggers a visual alert to advise the customer that the limit established by the Bank has been exceeded. The customer can cancel the order or confirm it, authorising it to be sent to the market.
- Upper threshold: when this is reached it displays that your order is rejected. Customers who still intend to place the order can contact an operator at the Bank’s call centre (free phone 800.52.52.52 ) who will decide whether to send the order to the market after carrying out the necessary assessments.
The thresholds have been determined according to two variables: the type of customer and the type of financial instrument involved in the orders.
Based on the equivalent value of the orders, four types of customer have been identified:
- Those who have placed executed orders with a maximum value of more than €1,000,000
- Those who have placed executed orders with a maximum value of more than €500,000
- Those who have placed executed orders with a maximum value of more than €100,000
- Those who have placed executed orders with a maximum value of less than €100,000
With regard to the types of financial instruments, three groups have been identified for the Euronext Milan market:
- Highly liquid securities (including all margin trading securities)
- Other securities traded continuously
- Other securities traded by auction only
The tables below show the alert and block thresholds according to the type of customer and the traded instrument.
Customers with executed orders of an equivalent value exceeding €1,000,000
| Market | Type of financial instrument | Alert | Block |
| Euronext Milan | Securities belonging to the FTSEMIB index | €1,250,000 | €2,500,000 |
| Euronext Milan | Other securities | €250,000 | |
| ETFPlus | All | €500,000 | €2,500,000 |
| MOT | All | €/$1,000,000 | €/$ > 2,500,000 |
| EuroTLX | All | €/$1,000,000 | €/$ > 2,500,000 |
| SEDEX | All | €75,000 | €150,000 |
Customers with executed orders of an equivalent value between €500,000 and €1,000,000
| Market | Type of financial instrument | Alert | Block |
| Euronext Milan | Securities belonging to the FTSEMIB index | €1,250,000 | €2,500,000 |
| Euronext Milan | Other securities | €250,000 | |
| ETFPlus | All | €500,000 | €2,500,000 |
| MOT | All | €/$500,000 | €/$ > 1,000,000 |
| EuroTLX | All | €/$500,000 | €/$ > 1,000,000 |
| SEDEX | All | €75,000 | €150,000 |
Customers with executed orders of an equivalent value between €100,000 and €500,000
| Market | Type of financial instrument | Alert | Block |
| Euronext Milan | Securities belonging to the FTSEMIB index | €1,250,000 | €2,500,000 |
| Euronext Milan | Other securities | €250,000 | |
| ETFPlus | All | €500,000 | €2,500,000 |
| MOT | All | €/$300,000 | €/$ > 500,000 |
| EuroTLX | All | €/$300,000 | €/$ > 500,000 |
| SEDEX | All | €75,000 | €150,000 |
Customers with executed orders of an equivalent value below €100,000
| Market | Type of financial instrument | Alert | Block |
| Euronext Milan | Securities belonging to the FTSEMIB index | €225,000 | €250,000 |
| Euronext Milan | Other securities | €75,000 | |
| ETFPlus | All | €225,000 | €250,000 |
| MOT | All | €/$200,000 | €/$ > 300,000 |
| EuroTLX | All | €/$200,000 | €/$ > 300,000 |
| SEDEX | All | €75,000 | €150,000 |
IDEM: Block for customers with executed orders of an equivalent value exceeding €3,200,000
> Frequency filters
Frequency filters do not block. The bank constantly monitors the number of orders it receives, and records events which result in exceeding the fixed thresholds in order to retain proof should other anomalies also require an analysis of the order placing frequency.
There are two types of messages:
- Instantaneous frequency alert if the customer enters more than three transactions in one minute.
- Daily frequency alert if the customer exceeds a certain threshold, which depends on the number of valid orders entered on average in the last 90 days, in accordance with the following table:
| Average number of orders over the last 90 days | Threshold |
| up to 10 orders | 20 |
| from 11 to 30 orders | 50 |
| from 31 to 60 orders | 100 |
| from 61 to 120 orders | 200 |
| more than 120 orders | 500 |